The Insider's Guide to Capital-Efficient Scaling Ft. Arata, Fashor, and Atomberg


- Published
- Reading Time
- 30 minutes
- Contents

In the Indian consumer brand landscape, there’s often a tension between rapid growth and financial discipline. While many startups choose the high-burn path to scale, some companies have made the interesting choice to prioritize capital efficiency alongside growth. We sat down with founders and operators from three such brands to understand how they navigate this balance, the frameworks they use, and the trade-offs they make. Each of these is at a different revenue stage and category.
- Arata (₹60 – 65 crore revenue): A haircare-focused D2C brand
- Fashor (₹100 crore revenue): A women’s ethnic wear brand and Blume Fund IV portco.
- Atomberg (₹1000 crore revenue): A technology-driven consumer durables brand
We’ve structured this article as three in-depth case studies that reveal the earned secrets of their founders and operators (which makes this a long read). We hope you enjoy this new format. Do let us know your feedback.
We understand that reading a 7000-word commentary is not for everyone. You can click here to skip directly to the end and get the TLDR for all three case studies.
And that’s not all. Here’s an AI-generated podcast that covers the best earned secrets shared by our guests that you can enjoy during your commute, run, or weekend.
Happy reading/TLDRing/listening!
Building a Profitable D2C Brand: Decoding Arata’s Path to Sustainable Margins
Chalo yaar, ek baat bohot achchi hai tumhari, you guys haven’t lost your sense of humour (One thing I’ll give you – you haven’t lost your sense of humor.)
During a tense moment on Shark Tank India in February 2024, Shaadi.com founder Anupam Mittal said this to Arata’s co-founders Dhruv Bhasin and Dhruv Madhok. (No typo, the Dhruvs don’t just share a vision but also their names.)
Dhruv Bhasin replies, “Anupam, if we lose it, we won’t be able to keep moving forward.”
Behind this light moment lies a serious obsession with numbers at Arata.
Consider their approach to business fundamentals: They discovered that their Amazon bestseller wasn’t the top performer on quick commerce, leading them to optimize each product for specific channels. They calculate margins based on actual selling prices, not MRP. “The delusion of making money at MRP never happens,” Bhasin says matter-of-factly. They’ve even let customers keep wrong deliveries and sent new products rather than process returns, as it was better for unit economics.
This obsession with numbers runs deep. Unlike most Series A companies, they’ve built a 5‑member finance team led by a full-time CFO. Every morning begins with checking their Daily Run Rate — what Madhok calls the “dhadkan” (heartbeat) of the business.
What follows is a detailed breakdown of how Arata built a 75% gross margin and 15 – 20% CM2 business; numbers most D2C brands desire. Whether you’re building a D2C brand or curious about the mechanics of sustainable unit economics, their experience offers hard-earned lessons.
Let’s dive in.
The Unit Economics Nitty-Gritty
As Arata scaled from INR 10 crore to INR 65 crore, three key metrics tell their story:
Average Order Value (AOV): A steady climb from INR 600 (at 10 crore revenue) to INR 800 (at 30 crore) to INR 950‑1000 (at 60+ crore).
Gross Margin Journey: Started at 81%, dipped to 65% while improving product quality, then stabilized at 75% with scale advantages.
Path to Profitability (EBITDA):
- At INR 10 crore: negative 75%
- At INR 30 crore: negative 15%
- At INR 60 – 65 crore, they’re between negative 5% and break-even.
But these yearly metrics only tell part of the story. Two daily numbers drive their decision-making:
1. Daily run rate (DRR): “DRR is the lifeline, we call it the ‘dhadkan’ of this business,” says Madhok, using the Hindi word for heartbeat.
They maintain a single-sheet MIS to track DRR at the SKU level per channel. Simple color coding — green for ascending, red for descending — allows them to spot and fix issues.
2. Contribution Margin 2 (CM2): Madhok says, “CM2 answers three fundamental questions:
- Is our pricing right?
- Is our marketing efficient?
- And most importantly, should we sell this product on this channel?
Their rule of thumb is, “As long as CM2 is positive and ideally double-digit, we should do more of that product on that channel at that price.”
The Mechanics of a 75% Gross Margin
A 75% gross margin puts Arata in rare territory for D2C brands. The Dhruvs credit this to three strategic decisions made as they scaled:
1. Smart supplier/manufacturer management: “We went back to the manufacturers and negotiated raw material costs. While earlier we were purchasing one item, now we were procuring three to four items from them,” explains Bhasin. They also renegotiated with their packaging vendors.
Madhok adds an important relationship dimension: “Build strong relationships with manufacturers. Avoid concentration, but with two or three power manufacturers, you can build a stronger relationship and they can offer better conversion charges, raw material costs, packaging material costs, and credit terms because it becomes a two-way relationship.They value you and you value them.”
2. Hiring a supply chain leader: Dhruvs emphasize getting an experienced supply chain leader as things start to scale, because a founder won’t have the bandwidth to tweak the 1,000 moving parts in the supply chain.
“Once we hired a talented individual to head our supply chain management, it became a dynamic system for structuring all costs associated with the overall COGS,” says Bhasin.
Besides managing COGS, this hire strengthened the supply backbone. “We created a tender process for new formulations and packaging. So we’re not dependent on a single manufacturer. We now have options where we are going dynamically,” adds Bhasin.
3. ASP-based margin strategy: Perhaps their most valuable insight is, “We factored in our gross margin at the ASP [Average Selling Price], not at the MRP [Maximum Retail Price],” reveals Bhasin. “A lot of brands make that mistake because there is a delusion of ‘hum MRP pe bechenge’ [we’ll make money at MRP], that never happens.”
By working backward from actual selling prices instead of theoretical ones, they ensure products are profitable in the real world. “We have a threshold gross margin and will not drop below that on the ASP level. So that ensures the product’s gross margin is healthy from day one, and we break it down on a channel level because the same product might have a different gross margin on different channels.”
Madhok distills their approach to a simple rule: “There’s a benchmark: anything above 75% gross margin, it’s a no-brainer, scale it up. If it’s 75%, keep it steady. If it’s less than 75%, work with your marketplace for waivers and better terms. If not, reduce discounting.”
4. Disciplined discounting: “How we got from 73% GM to 75% is through a concerted effort to pull back on discounts without affecting our revenue,” Bhasin explains. “We now have a tiered discounting structure.”
The Channel-SKU fit
One of Arata’s most important discoveries was that product performance varies dramatically across channels. Bhasin explains, “My top products on quick commerce aren’t the same as on Amazon. Amazon’s top products aren’t my website’s top ones. There’s an overlap, but a visible top product difference across channels.”
This insight led them to analyze data more granularly and link it to custom messaging on different channels. Instead of pushing the same messaging across all platforms, they optimize marketing for each product’s best-performing channel.
“Say a shampoo is my top seller at the aggregate, business level but it may not be the top seller on quick commerce,” notes Bhasin. “But if your marketing spends and overall share of voice or brand voice, is targeted towards that shampoo, you won’t be able to optimize and make most of that specific channel.”
The Key to D2C Success: Experiment, Experiment, Experiment
A key aspect of Arata’s success is experiments across UX, logistics, marketing, and more, stopping the failed ones and doubling down on the successful ones. Some experiments have become crucial to their profitability mix. Here’s a glimpse:
UX/UI innovations: UX experiments span multiple aspects of the business. “Do we want to change the prepaid to COD ratio on the website? Do we want to reduce the items per order to lower shipment weight or volumetric weight?” Madhok explains.
“We created a ‘Build your Own Box’ feature on the website. Add any four items to your cart and get the package at a lower price than the 4 priced individually. This forces the customer to discover the entire assortment and add something from each subcategory to their cart.” This increased AOV while deepening brand engagement, though it required offering deeper discounts.
Logistics optimization: They identified that packages over half a kilogram significantly increased shipping costs and reworked the packaging materials to reduce weights.
Return policy innovation: In a counterintuitive experiment, they let customers keep products that were incorrectly delivered and send replacements. “We do not want to do a Return to Origin (RTO) for the wrongly delivered product because the RTO will be more expensive than just sending the replacement product,” explains Bhasin. This unorthodox approach improved both customer experience and unit economics.
Mind you, each experiment needs its timeframe for validation — understanding this is crucial for making informed go/no-go decisions.
Marketing changes: “If there’s a marketing change, we’d wait 7 – 14 days to see the impact on that campaign,” says Bhasin.
New product launches: “If it’s a miniature product intervention, it takes around a month or more depending on the platform,” Bhasin continues. “On the website, we can see DRRs from day 1. But by the time this product is listed, purchased, and visible on quick commerce, it takes about 14 to 21 days.”
The Financial Nervous System of Arata
Early-stage D2C companies often struggle with visibility of key metrics and make decisions with half data. Arata tackled this by building a multi-layered MIS.
“We have regular check-ins with each team weekly,” explains Bhasin. These start with their daily MIS: “We see the sell-through on every channel, every day. It’s colour-coded so if it’s an ascending DRR, it’s green. If it’s descending, it’s neutral to red. We can easily see if the sales increased or decreased on a day.”
The daily metrics feed into weekly reviews with the CFO and finance team, where “we take learnings and create a bunch of questions for the next meetings with different team heads.”
This cascades into monthly P&Ls for each channel. “It’s a real-time P&L showing the month-to-date and previous month P&L,” adds Bhasin.
Monthly investor MIS: “We have a monthly MIS for all investors,” says Madhok. This comprehensive report was initially challenging for the Dhruvs. “It was daunting; we initially didn’t have this data monthly. But once we started filling it, this template taught us to look at things granularly from a P&L, cashflow, cohort, LTV, and channel perspective… it’s super granular.”
Arata also had the conviction to invest early in senior finance talent. “From a very early stage, in 2022, three years into the business, we decided to bring finance and HR heads in-house,” explains Madhok.
“This is counterintuitive. Most brands in years one, two, and three don’t do these things. They’re like, ‘Haan, jab bade honge, jab hum 100 crore pe paunchenge, [We will do it when we scale to 100 crores], then we’ll bring these capabilities in-house.’ But this early investment gave us more ammo to bring additional capabilities in-house as we progressed.”
Bhasin unpacks the scale of their finance operation, “Our CFO has a team of five. That’s the importance we give to the tracking numbers and metrics.”
How do They Track New Product Launches
Before we get into tracking, it’s useful to see their current product thinking. Their new product philosophy evolved from “exponential invention in a smaller segment” to “incremental innovation in large market segments.”
Bhasin explains, “If we can make something incrementally better, we can create something unique. It may not be 100% different, but it doesn’t have to be. It needs to be perceived as unique.”
Madhok shares an example of this process in action.
“We start with the insight that serums are the fastest-growing category. Then we understand that damage and frizz are the largest concerns. So we multiply. We marry a serum format into damage and frizz. Then we do consumer testing and discover they benchmark our product against a bestseller. We do customer trials and we ask, ‘What do you like about our product compared to others?’ Sometimes you get counterintuitive insights like, ‘We like the lightweight texture.’ So, now suddenly, we’ve got a serum for damage and frizz control, multiplied by lightweight texture. It’s a perfect differentiation from the bestseller.”
After launch, they track different metrics to determine the product’s success.
1. DRR trends: “Even if the early numbers are small, if it’s moving up, that’s a green shoot,” says Madhok.
2. ROAS for new customer acquisition: “The return on ad spend for top funnel, new customer acquisition for that product,” is the second key indicator, according to Madhok.
“ROAS isn’t just a metric; it reveals a deep insight into consumer psychology and belief in your value proposition. A ROAS of 10 means you’ve nailed it, understood consumer requirements very well. Your value proposition is perfect, making them willing to pay a premium. If your ROAS is half of that, it doesn’t mean to scale up your spend and acquire customers inefficiently. It means your value proposition is poor.” This helps them avoid the common trap of throwing money at a product that isn’t resonating with them.
“Return on ad spends for new products are usually lower. But if a product has good DRR and ROAS, then you just throw the kitchen sink at it and go all in.”
Evolution of their Marketing Engine
Arata’s marketing strategy has evolved as they’ve scaled.
Early Stage (0−10 crore): “The brand spend was about, first two years, sub 5%,” reveals Bhasin. “In those two years, we barely spent anything on brand because I think in your early years, you’re looking for attributable revenue. You’re trying to determine product-market fit, whether you’re bootstrapped or VC-funded.”
Madhok double clicks on their approach: “In the early days, we didn’t have the luxury of investing in brand marketing. As a brand scales, it’s important and healthy because initially, performance marketing keeps you going. When you don’t have deep pockets, and you’re on a tight budget, you have to do convert ₹ 1 into ₹ 2 or ₹ 3. You can’t spend ₹ 1 today and wait for 6 months to see what brand lift you will get.”
Growth Stage (over ₹ 30 crore): As they grew, they maintained a heavy focus on performance marketing, with brand spending still accounting for a small percentage of their overall marketing budget.
Current Stage (₹ 60 – 65 crore): “We’re closing around 60 – 65 this year, and we’re on the 100 crore-plus journey. We’re allocating 10 – 20% of marketing spends in the coming year to brand,” says Bhasin.
Their performance marketing is based on the Reasons to Believe framework.
“There’s a Reasons to Believe (RTB) sheet. What is the product? What is its USP? What are the ingredients? What are the benefits? How do the ingredients support those benefits and USP? What is the visual representation? What is the sensorial representation?”
Based on this RTB framework, Arata has developed a scientific approach to performance ads. “We’ve broken performance ads down to a science — what to appear in the first three seconds, in six seconds, eight seconds, all the way to 15 seconds,” explains Bhasin. Each segment serves a specific purpose: the first three seconds need a strong hook “to get the consumer to stay, stop scrolling, and watch the ad.”
“The core message will remain the same, but each platform needs specific adaptations,” Bhasin explains. “Amazon requires wide backgrounds, while Flipkart and Myntra allow strips calling out product benefits. The A‑plus content (product page) remains similar across channels, just adapted for different specs and sizes.”
Once they know what’s working, they double down using the “double diamond strategy.” As Bhasin explains, “You find what’s working — which creative, which campaign, which tagline. Then you create two more underneath it and again test. So you continuously keep building on what’s working and keep shifting out what’s not working.”
Building Like a Business, Not a Startup
Perhaps the most profound insight from Arata is their approach to building a business.
“From the very beginning, if I remember correctly, we haven’t referred to ourselves as a startup. We’ve always called ourselves an e‑commerce business,” reflects Bhasin.
This isn’t mere semantics — it reflects a fundamentally unique approach to building. “We’re looking at ourselves from a larger lens, and from that larger lens, there’s a lot to achieve.”
Arata shows that the path to profitability doesn’t have to come at the expense of growth. By focusing on unit economics, conducting disciplined experiments, and thinking like business owners rather than startup founders, D2C brands can build sustainable enterprises that create genuine value while maintaining control over their destiny.
As Bhasin states, “We want to operate from love, not fear.” This philosophy, choosing to build from a place of confidence in fundamentals rather than anxiety about the next funding round, may be the most valuable lesson.
The Science of Style: Inside Fashor’s Capital-Efficient Path to ₹100 Crore Topline
In the glittering but cutthroat world of Indian fashion e‑commerce, most startups follow a familiar playbook: raise massive funding, burn through capital for rapid growth, and consider profitability later. Amid this high-stakes game, one brand has taken a dramatically different path.
Fashor, the women’s ethnic wear brand and Blume Fund IV portco, has scaled to ₹ 100 crore+ in revenue while raising minimal equity — a stark contrast to peers who typically need 2- 4x more capital to achieve a similar scale.
How did they achieve capital efficiency while building a brand stocked in Shoppers Stop and Lifestyle, with Bollywood celeb Sara Ali Khan as brand ambassador, and driving 50% of D2C revenue through its app?
CEO and co-founder Vikram Kankaria says their secret lies in a data-driven approach to product development and a unit economics discipline from day one. “We are half a fashion company, half a data company,” he explains, describing a model that’s fundamentally different from traditional fashion brands.
This deep dive reveals specific strategies for capital-efficient growth while building an aspirational brand in a hyper-competitive market — from a distributed design network that tests hundreds of designs monthly to site selection for retail stores and sophisticated cohort-based metrics tracking.
Let’s explore Fashor’s journey and unpack these earned secrets.
Starting with D2C and Not Marketplaces
While many D2C brands leverage marketplaces for quick growth, Fashor made a deliberate decision to start by selling directly to customers.
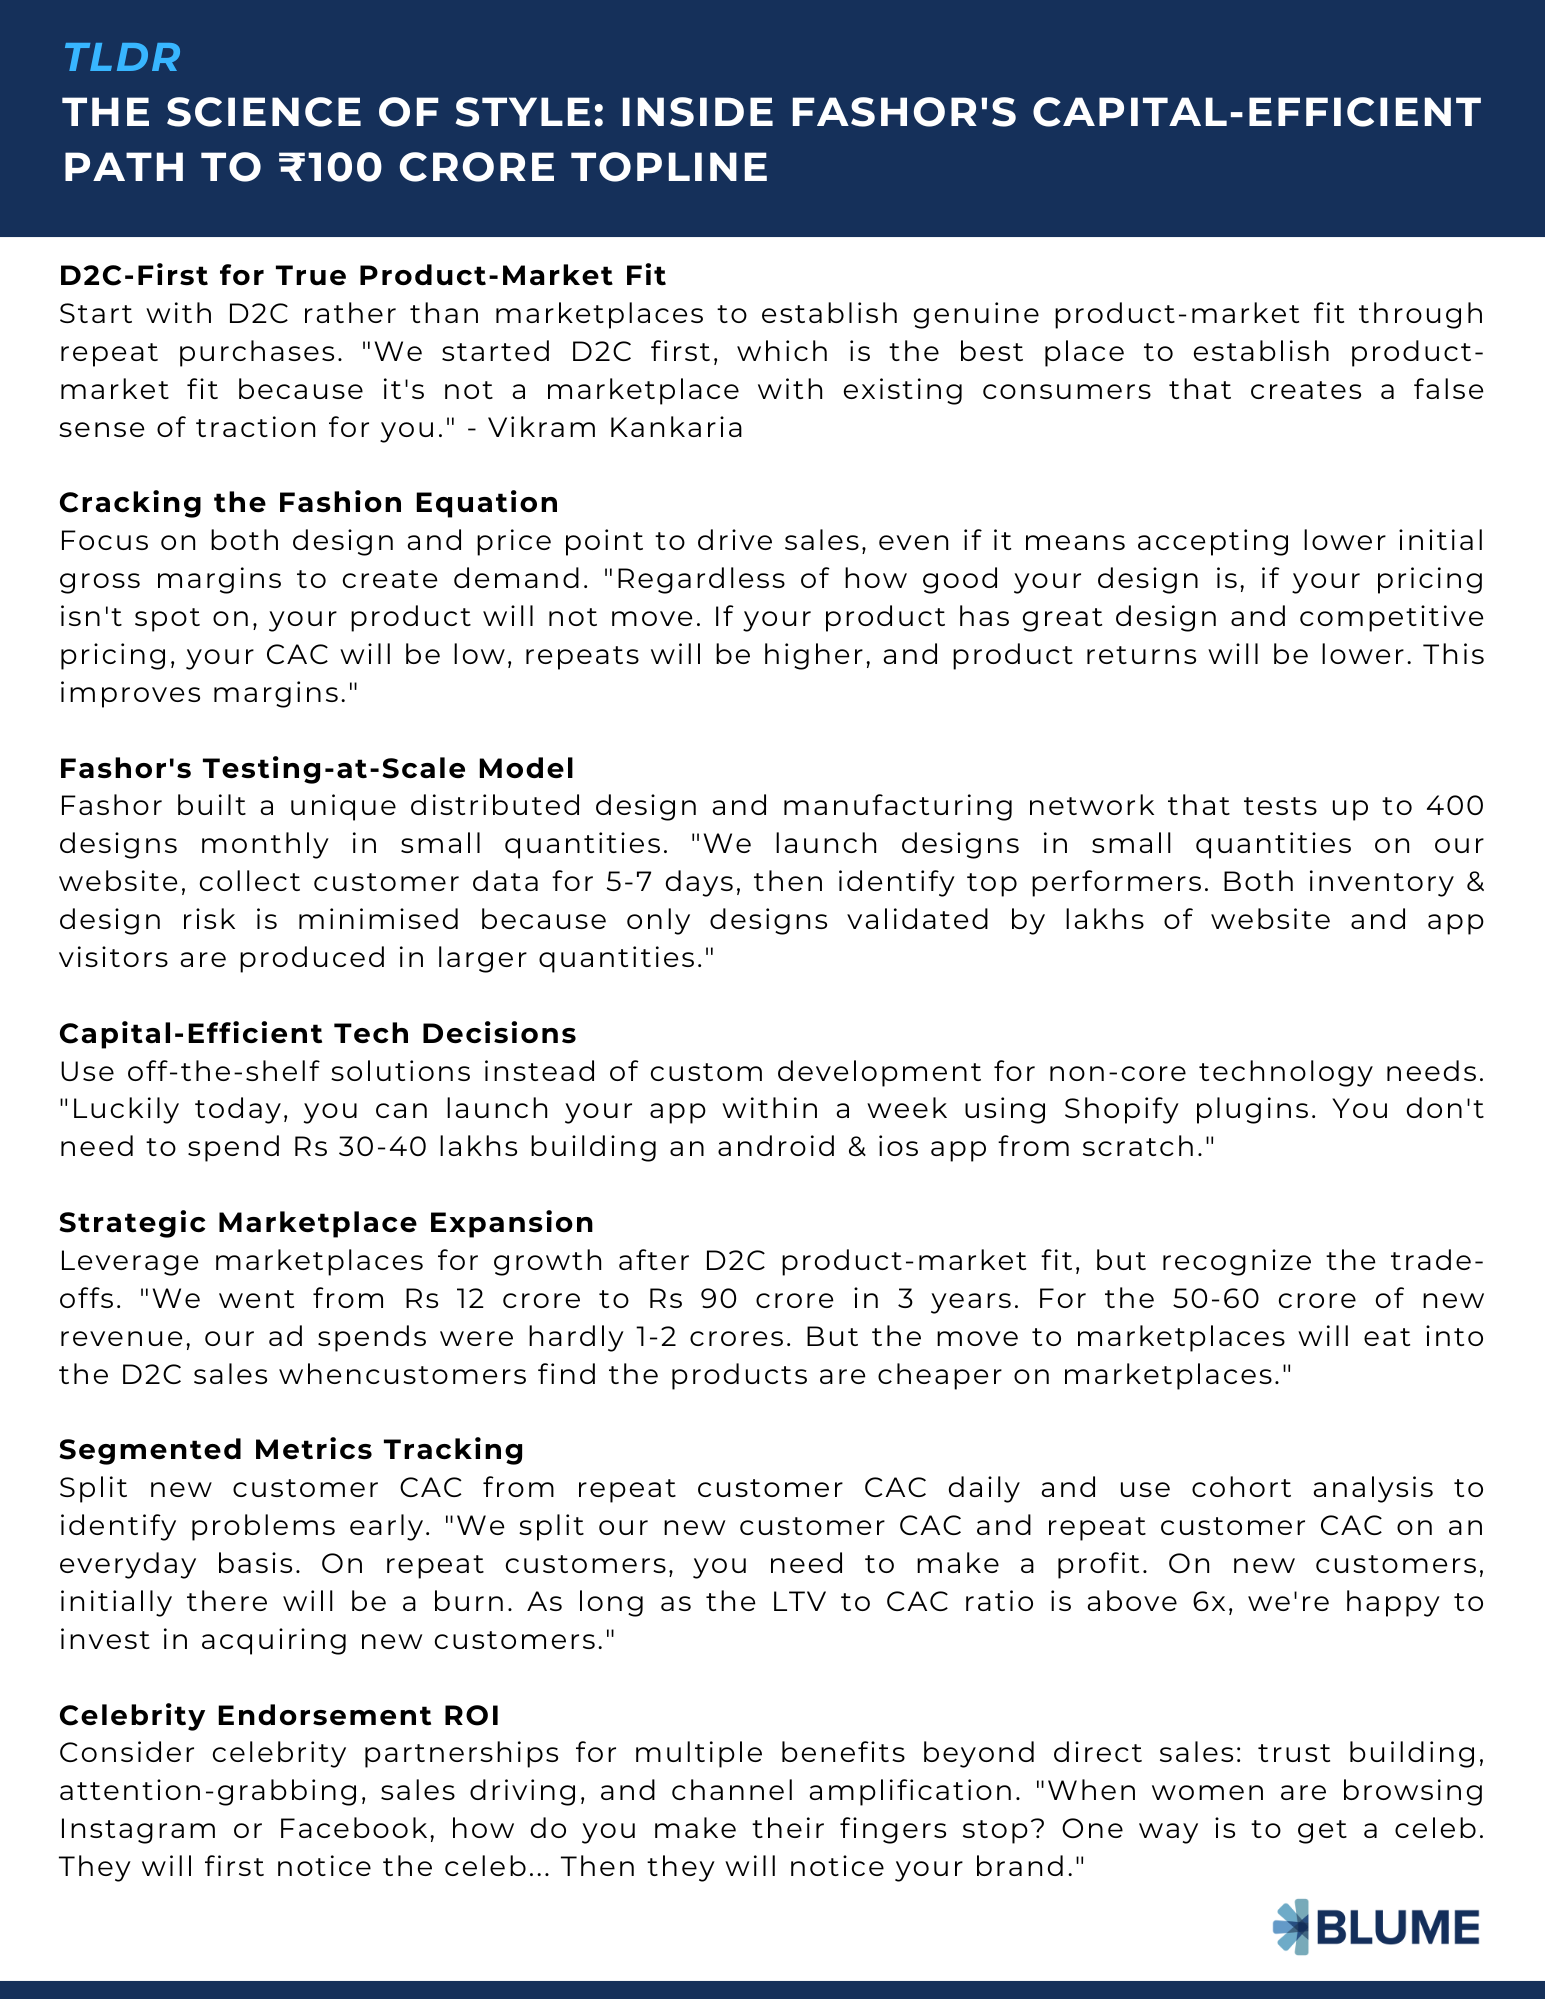
“We started D2C first, which is the best place to establish product-market fit because it’s not a marketplace with existing consumers that creates a false sense of traction for you,” Vikram explains.
This decision was particularly bold given their context:
- A new brand with no awareness.
- Mid-premium pricing (₹1500 – 2000 ASP).
- TG: 30 – 45 year-olds, not digitally-native millennials.
- 70 – 80% of fashion purchases occur in offline stores, even in mature markets like the US and China.
This D2C-first approach allowed Fashor to gauge a genuine product-market fit through repeat purchases. “If people interact, purchase, and return for a repeat purchase, they truly like our product.”
The results validated their strategy: “Our repeats were highest in the industry, 40 – 45% of our customers repeated vs. 30% industry benchmark in D2C. Our year one revenue repeat was 130 – 140%.”
This strong customer loyalty translated directly into superior unit economics: an LTV:CAC ratio of 7 – 8x, significantly higher than the industry standard of 3 – 4x.
Fashion Equation: Sales = Design + Price
Fashor identified a clear market gap: “The big problem we wanted to solve was that India’s aspiring middle class wants to dress fashionably, but doesn’t have affordable brand options.”
The women’s fashion market is a massive $25 – 30 billion industry, and ethnic wear has a 70 – 75% market share. Over 80% is unbranded, with only a few premium brands at ASPs of ₹ 4,000-₹ 5,000.
“That’s not affordable,” Vikram notes. “While their positioning is premium, is the product or design equally premium?”
Vikram emphasizes the need to crack both design and price.
“Regardless of how good your design is, if your pricing isn’t spot on, your product will not move,” Vikram explains. Fashor set prices lower than existing brands while maintaining quality, aiming to democratize access to branded fashion. This decision resulted in lower gross margins to start with (more on how Fashor solved it shortly), but was key to starting their demand flywheel.
The lower price point created a virtuous cycle for unit economics: “If your product has great design and competitive pricing, your CAC will be low, repeats will be higher, and product returns will be lower. This improves overall margins, but a lower price approach only works if your business model supports a low-cost structure.”
Fashor’s ability to maintain this pricing discipline stems from its unique supply chain – the foundation of its capital-efficient model.
Testing at Scale: Fashor’s Data-Driven Supply Chain
Perhaps Fashor’s most innovative strategy lies in its supply chain. While traditional brands rely on small in-house design teams for seasonal collections, Fashor built a distributed design and manufacturing network.
“When we started, we launched 50 designs a month. Then we realized that ecommerce is an endless aisle & you can offer a larger variety to customers across every-day wear, office wear, festive wear & occasion wear. You don’t have the limitations of an offline store,” Vikram explains. “That’s how we went from launching 50 designs a month to 400 designs a month.”
This high volume is achieved through a unique, data-driven model:
- Apart from the in-house design team, a network of vendors creates design samples based on the trend deck & inputs shared by the brand.
- From these design samples, Fashor shortlists the best designs to launch in small quantities on their website.
- After 5 – 7 days of collecting real customer data data, Fashor identifies the top-performing designs.
- Only the top performers are produced in large volumes.
This model minimizes inventory risk — a major cost driver in the fashion industry — while maximizing design variety. “Both inventory & design risk is minimised because we listen to our customers & only designs validated by lakhs of website and app visitors are produced in larger quantities.”
This contrasts sharply with traditional brands. “Big brands typically have a design team of 5 – 10 people deciding what to launch, then committing to 10,000−25,000 pieces in production…they aren’t baking in customer feedback at scale into their designs.”
The vendor network is continuously optimized. “Top vendors give us 50% of our volumes. The bottom 10 – 20% vendors keep churning, and we keep adding better ones. It’s a continuous cycle.”
Currently, this approach is cost-neutral compared to traditional manufacturing. “Doing smaller batches initially costs slightly more, but for the bestsellers, we give huge quantities to vendors, which averages out the price.”
This model becomes increasingly advantageous with scale, directly improving unit economics: “As we move towards ₹ 500 crore, the initial production runs for our 400 monthly designs stay the same, but repeat quantities for bestsellers jump by 3 – 4x. At scale, we disproportionately produce winning designs, giving vendors larger volumes and driving our unit costs down.”
Capital-Efficient Tech Decisions
Fashor’s capital-efficient mindset extended beyond product and marketing to technology infrastructure. Instead of the typical ₹30 – 40 lakh investment in custom app development, Fashor opted for Shopify plugins costing just $1000/month.
Luckily today, you can launch your app within a week using Shopify plugins. You don’t need to spend ₹ 30 – 40 lakhs building an android & ios app from scratch,” Vikram explains. This lean approach paid off — today, 60% of their D2C revenue comes through their app.
Their business model, featuring frequent design launches, also fuelled app adoption. “Many women, out of passion and curiosity, check out the brand every few days because they know they’d see 40 – 50 new designs,” notes Vikram. This natural engagement created a high-value channel with minimal upfront capital expenditure.
The Unit Economics of Brand Building
Fashor’s gross margins improved steadily by ~10% as they scaled from ₹ 10 crore to ₹ 100 crore. This improvement resulted from two main drivers contributing to better unit economics:
1. Scale benefits: “When you’re small scale, your production quantities are smaller, so your cost of production is higher. That changes your margin structure with your vendors. Automatically with scale, you get 10 – 15% lower costs.”
Vendor relationships also evolve: “You become a respected brand with vendors; there’s familiarity and comfort working with you. So they’re willing to work at lower margins because they get more work from you.”
2. Brand equity: Improved brand perception contributes significantly. “As you scale, you keep improving the shopping experience and also start putting out better content — photo shoots get better, the way the collection is presented gets better.”
These investments change consumer perception, justifying better pricing. “People start seeing you as a brand & not just a label. When they receive their shipments, the packaging is also high quality, right from tags to labels to the material. That helps build the brand slowly.”
This brand equity provided pricing power, allowing Fashor to increase prices incrementally, with annual price increases of 5 – 7% over the years.
Fashor takes a disciplined approach to price increases, monitoring customer feedback closely: “You check your sell throughs, conversion rates, repeat frequency across your cohorts. These will tell you how customers perceive your price.”
The Marketplace Decision
After establishing a strong product-market fit via D2C, Fashor expanded to marketplaces, dramatically fast-tracking growth. “We went from ₹ 12 crore to ₹ 90 crore in 3 years. Marketplaces did that for us; they put us in front of millions of customers & accelerated brand building for us.”
What’s remarkable about this growth is how little the brand spent to achieve it. “For the 50 – 60 crore of new revenue, our ad spends were hardly a crore or two,” Vikram reveals. This efficiency wasn’t luck — it was a direct result of their data-tested design approach. The marketplace algorithms favored their products because they were proven winners with customers, creating a virtuous cycle of organic visibility and sales.
However, Vikram acknowledges this came with trade-offs, particularly impacting the D2C channel.
“The move to marketplaces and aggressive expansion was a double-edged sword, as it ate into our D2C sales a bit. Marketplaces run frequent sales events — monthly, bi-monthly, even weekends — meaning our products are sometimes cheaper there than on our own website.”
This price difference drives specific consumer behaviour that impacts D2C: “Customers, once they know a brand is available across channels, will compare prices and often buy from the cheapest source. This makes it harder to offer a unique D2C experience.”
Ultimately, Fashor prioritized the capital efficiency of marketplace-driven scale over maximizing D2C control — a critical trade-off every brand must evaluate.
Metrics that Matter
Underpinning Fashor’s capital efficiency is a sophisticated approach to metrics tracking, focusing on data that directly informs profitability:
1. Segmented CAC: “We split our new customer CAC and repeat customer CAC on an everyday basis. You have to split. Don’t just look at blended CAC.”
This separation is critical for managing unit economics. “On repeat customers, you need to make a profit. You know your gross margin and variable costs… So you have to ensure your performance marketing cost generates a profit for you.”
New customer acquisition requires investment: “On new customers, initially there will be a burn, because new customer CAC is higher.”
The investment decision is strictly based on expected returns. “We accept the burn because we know over 40% of our customers repeat, and we know their frequency and lifetime value. As long as the LTV to CAC ratio is above 6x, we’re happy to invest in acquiring new customers.”
2. Funnel Metrics: Fashor tracks the entire customer journey:
- Ad click-through rates
- Time on site
- Product page views
- Add-to-cart rates
- Checkout conversion
- Purchase completion
3. Cohort Analysis: Tracking customer behavior over time is crucial. “Month 0, how many repeated? Month 1? We track customer and revenue repeat trends monthly.”
This provides early warning signals for potential issues impacting profitability. “A drop-off indicates a problem with pricing, collection, or maybe competitors are running heavy discounts pulling customers away.”
4. Marketplace-Specific Metrics: For marketplaces, they look at different indicators:
- Overall margins and CM2
- Repeat purchase behavior
- Product return rates
- Search volume for the brand
- Average order value trends for repeat customers
To Celeb or Not to Celeb
To accelerate growth, Fashor signed Bollywood actress Sara Ali Khan as a brand ambassador. This significant investment was carefully weighed across multiple potential benefits:
1. Trust building: A celebrity endorsement builds credibility, especially for an online-first brand. Vikram says, “New customers haven’t seen you offline… they don’t know how big you are. When they see a celebrity, they trust you more & conversion rates improve.”
2. Attention-grabbing: In crowded social feeds, a familiar face stops the scroll. “When women are browsing Instagram or Facebook, how do you make their fingers stop? One way is to get a celeb.” This creates an immediate engagement opportunity: “They will first notice the celeb… Then they will notice your brand.”
3. Sales driver: Vikram mentions that many customers aspire to wear what celebrities wear. “If the outfit is available for 2,000−3,000 bucks… there’s hunger to wear the same outfit as Sara. We’ve sold 8,000−10,000 pieces of the design she is wearing in the ads.”
4. Channel amplification: The celebrity relationship strengthens marketplace and retail presence. “You get free organic reach because your e‑com & offline partners will show your banner since you have Sara on that banner rather than a regular model.”
This creates a multiplier effect: “All your channel partners love this. It is easier for them to sell a brand with a celeb to their customers.”
The celebrity association also helps with franchise recruitment: “Franchisees wanting to take your store invest 70 – 80 lakh. It gives them confidence that this is a brand of stature.”
This confidence extends throughout the business ecosystem, “So the way they perceive, treat, and interact with you change. All these soft factors affect employees, channel partners, and franchise partners.”
Fashor’s experience indicates that while onboarding a celebrity is certainly a big financial bet, it brings advantages that move the needle on the business metrics.
Taking Online Success Offline Using Data
As Fashor expands offline (now in 40 cities across 90 Large Format Stores and 6 EBOs), they apply the same data-driven rigor used online, combining three data sources with an omnichannel inventory advantage:
1. E‑commerce heat maps: Before entering a new market, Fashor analyses its existing customer base. “We look at hardcore data — which cities and pin codes generate the most orders in e‑com. This shows us where customers already love our products.”
2. Department store performance: Their presence in large retail chains serves as a testing ground for standalone stores. “From Shoppers Stop and Lifestyle data, we know that if a 200 square feet counter generates ₹ 8 – 10 lakhs monthly, a 1000 square feet store would easily deliver ₹ 30 – 40 lakhs.”
3. Ground research: The team validates the data through on-the-ground research. “We visit high-traffic areas and talk to existing fashion retailers about their sales and rent. Most retailers are transparent — if you know their rent and revenue, you can quickly calculate if a location makes sense.”
4. Omnichannel advantage: Their e‑commerce foundation enables superior inventory efficiency compared to traditional offline retailers. “Our stores are fully omnichannel. From a 2,000-piece inventory, ~600 pieces sell in-store monthly, another ~600 fulfil online orders, allowing us to replenish over 1,000 pieces with fresh designs frequently.”
This creates a continuously fresh retail experience. “Every month when customers walk into the store, they’ll find 100s of new designs. That’s the beauty of an e‑com brand with a large order base going offline.”
Fashor has proven that capital efficiency and building a fashion brand aren’t mutually exclusive. Their success highlights key lessons for founders: prioritize deep customer understanding through direct-to-consumer (D2C) before scaling, build a supply chain that minimizes inventory risk using data, make lean technology choices, and maintain rigorous discipline around unit economics. By embedding data into every core decision, Fashor shows that capital efficiency is not a constraint but a strategic advantage for sustainable growth.
What a Fan: Atomberg’s Playbook to Build a ₹ 1000 Crores Brand Sustainably
“Kya yeh fan bijli bachata hai?” (Does this fan save electricity?) is a central theme in Atomberg’s ads, along with the stress on its BLDC technology. This seemingly simple question encapsulates not just their product promise to customers but also mirrors the company’s focus on efficiency and optimization.
Atomberg has focused on juicing out the resources to build a capital-efficient consumer durables business, a category notorious for thin margins and capital-intensive operations.
They’ve reached around ₹ 1000 crore in annual revenue, while limiting their burn rate and still investing aggressively in technology and brand building. Counterintuitively, they improved their gross margins while scaling rapidly — a feat that most manufacturers deem impossible.
This article unpacks earned secrets from Atomberg’s Chief Business Officer, Arindam Paul, revealing:
- Counterintuitive strategies that can boost gross margins
- How to leverage technology R&D and vertical integration not just for product innovation, but for direct margin expansion.
- A disciplined framework for entering new categories, evaluating product-market fit, and setting prices.
- What to measure for a mature vs. a new category.
- Actionable insights on procurement, brand building, and financial discipline from day one.
Let’s go.
Balancing growth and profitability from day one
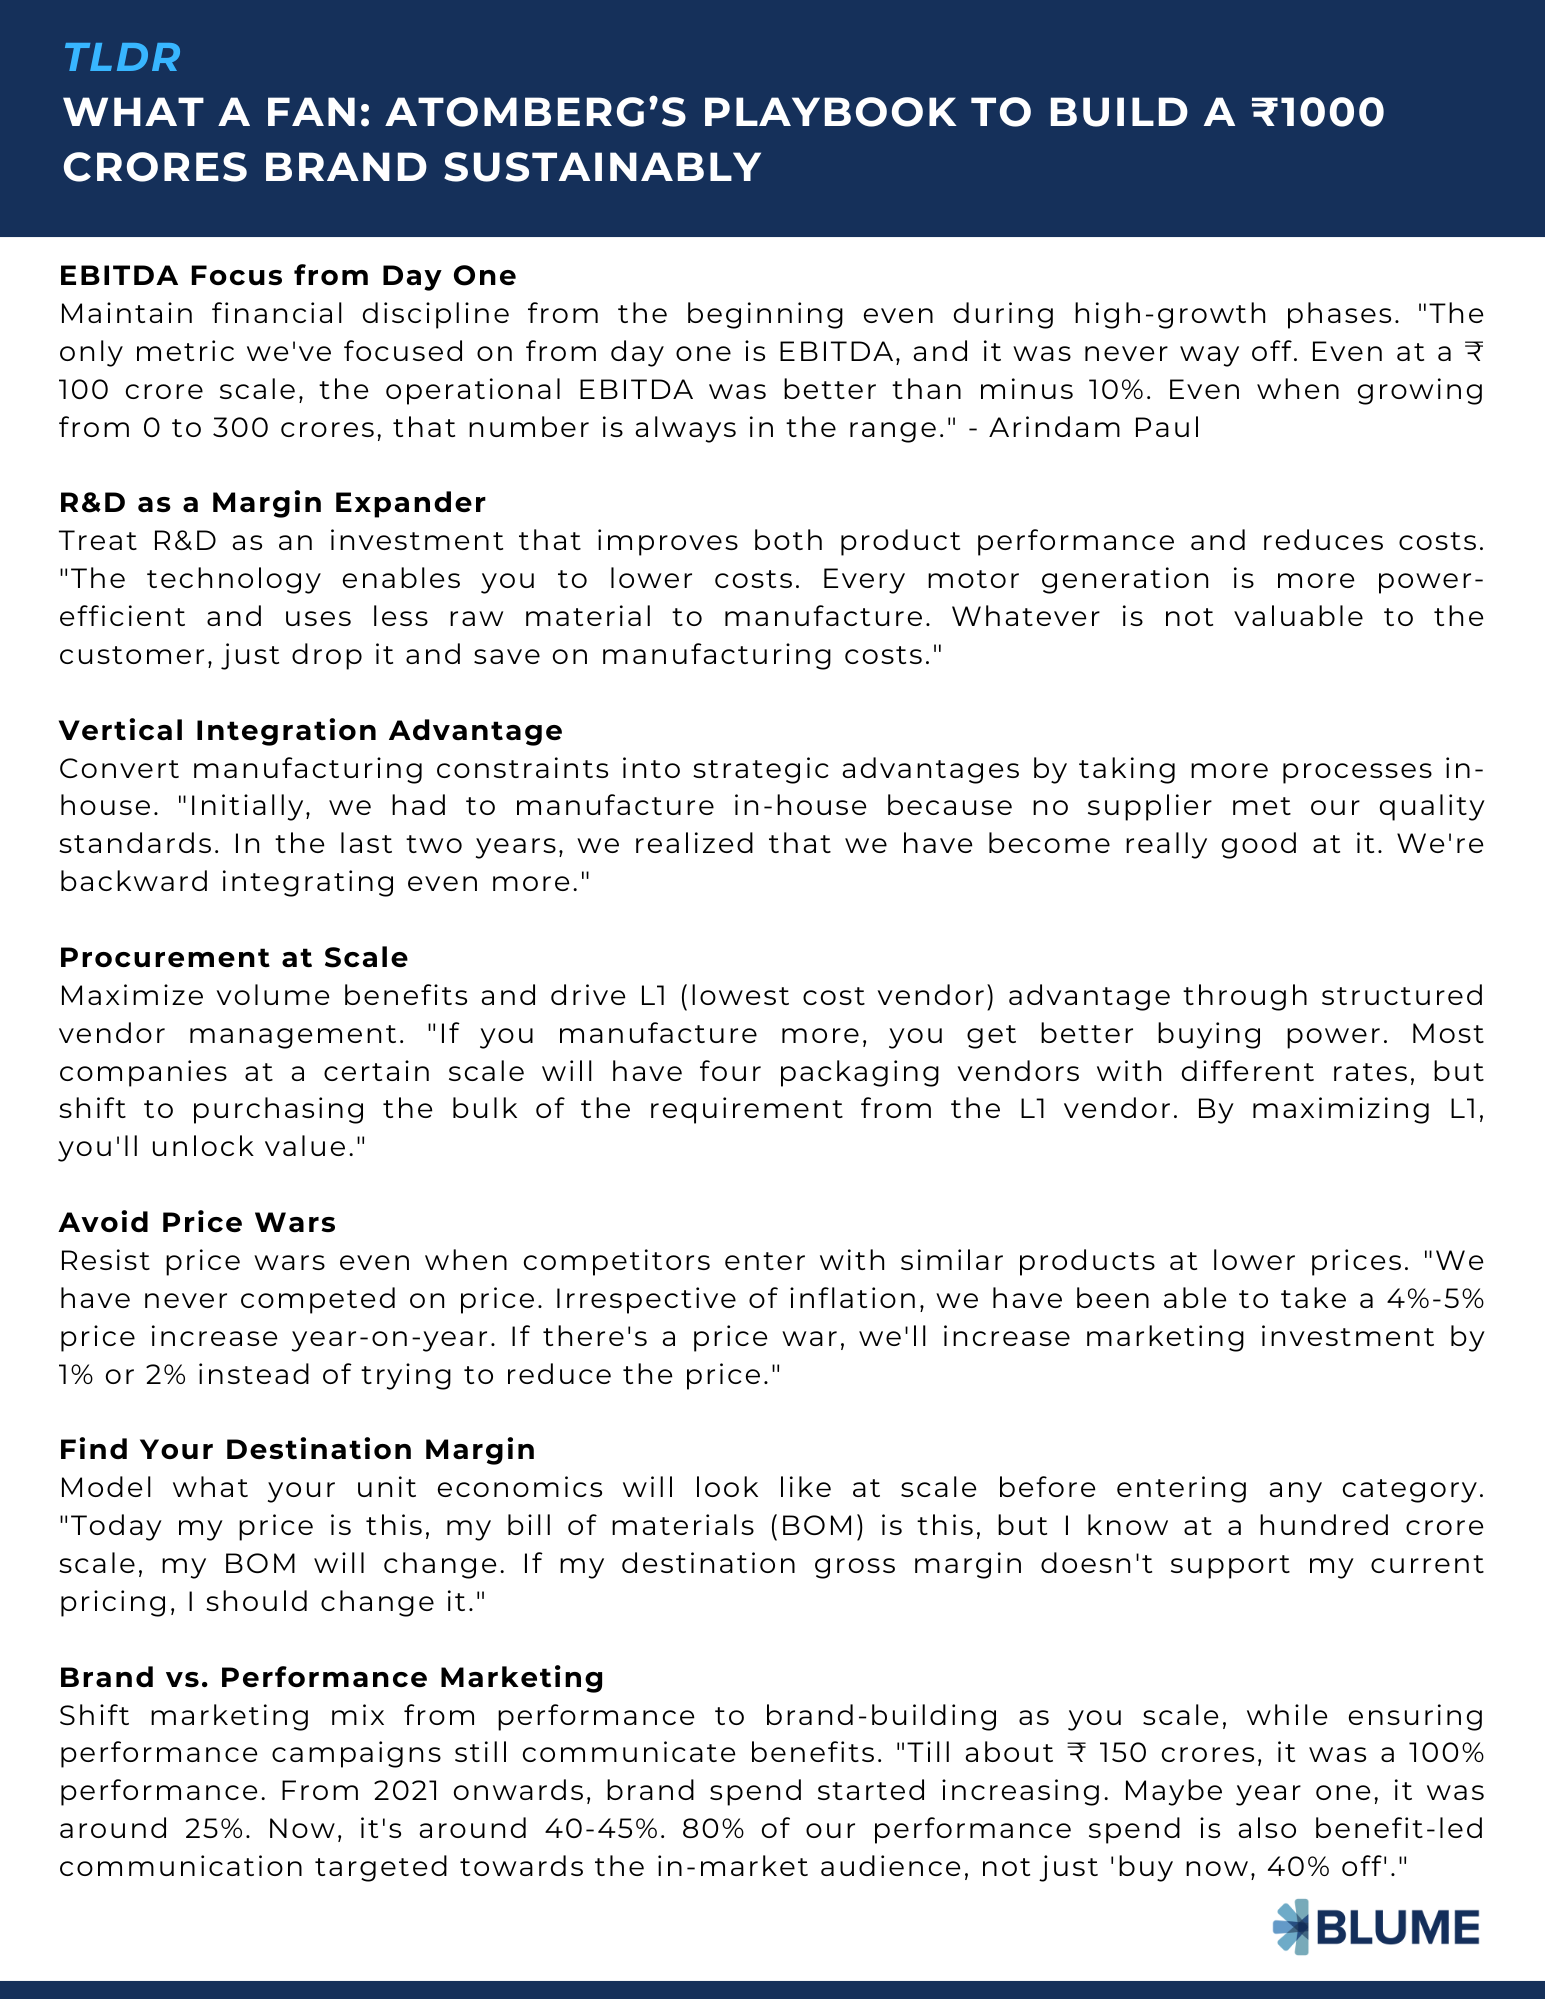
Unlike many startups that prioritize growth over profitability, Arindam emphasizes maintaining financial discipline from the beginning. “The only metric we’ve focused on from day one is EBITDA, and it was never way off. Even at a ₹ 100 crore scale, the operational EBITDA was better than minus 10%.”
Even in high-growth phases, they maintained this discipline: “Even when growing from 0 to 300 crores, that number is always in the range. Like always better than minus 10%.”
He points to their EBITDA improving consistently over time and always being CM2 positive.
Arindam outlines additional margin expansion levers that work beyond the ₹ 1000 crores scale:
- More scientific pricing across SKUs. “By optimizing pricing, gross margins can go up by another 2 – 3%. How do we become more scientific in our pricing? For some SKUs we can increase price by say ₹ 100 rupee without dropping sales, while others might benefit from a 50 rupee reduction, maintaining good margins.”
- Reducing marketing spend to 5 – 6% of sales is possible as brand awareness grows.
- Benefits of scale in staffing costs
- Continued procurement optimization
Four Drivers of Margin Expansion
Most consumer durables companies see margins compress as they scale. Arindam highlights how Atomberg counterintuitively expanded margins while scaling. “The single biggest profitability improvement over the last 3 years has been gross margin improvement,” explains Arindam.
This wasn’t achieved through typical cost-cutting or compromising quality. Instead, Arindam points to four strategic levers that expanded margins while improving product quality:
R&D as a Margin Expander
Arindam suggests treating R&D as a margin-expanding investment, not just a product development cost. “The technology enables you to lower costs. Every motor generation is more power-efficient and uses less raw material to manufacture,” Arindam notes.
This achieves two goals: better customer performance and lower production costs for the company. This creates a powerful competitive advantage that compounds over time.
He offers two lenses to look at this: Firstly, what do your customers value? If there are features that they don’t value but you’re adding to your product, it will add bloat to your manufacturing cost. So, whatever is not valuable to the customer, just drop it and save on manufacturing costs.
Secondly, better R&D leads to a better manufacturing processes, which in turn leads to fewer assembly line rejections. This again saves manufacturing costs.
This technology-driven approach links R&D and pricing power. By creating motors that are fundamentally more efficient than competitors’, Atomberg can justify premium pricing while reducing manufacturing costs, leading to better margins. The consumer gets a better product experience (lower electricity bills, quieter operation), which competitors struggle to match without similar R&D investments.
Vertical Integration: From Constraint to Advantage
What started as a necessity became a strategic advantage. “Initially, we had to manufacture in-house because no supplier met our quality standards,” Arindam recalls. “Now we see it as core to our margin strategy.”
This constraint became a unique advantage. “In the last two years, we realized that we have become really good at it. We’re backward integrating even more. For example, two years ago, my blades were painted outside. We’re taking that in-house. So, we have a paint shop in our factory.” This vertical integration provides a cost advantage and speed.
Arindam remarks that this also improves capacity utilization. If you have already set up a manufacturing unit, the more it is utilized, the lower your production costs per unit.
Leveraging Scale for Procurement Wins
Scale translates directly to procurement advantages in manufacturing. “If you manufacture more, you get better buying power. For example, you’ll buy raw material at a certain rate at ₹ 100 crores, but at a cheaper rate at ₹ 1000 crores.”
Beyond volume benefits, Arindam emphasizes driving the L1 (lowest cost vendor) advantage. “Most companies at a certain scale will have four packaging vendors with different rates, but shift to purchasing the bulk of the requirement from the L1 vendor. By maximizing L1, you’ll unlock value.”
His suggested approach to vendor management includes structured events: “Once your specs are finalized, do a proper packaging demo day, invite multiple vendors, give your specs, and let them give their quotes.” Arindam says this for packaging vendors. This creates a competitive dynamic among suppliers and prevents dependency on a single vendor.
Building a Premium Positioning
Arindam emphasizes maintaining premium positioning through both pricing and communication strategy. On pricing, he notes consistent increases of 4 – 5% year-on-year are possible. “We have never competed on price. And irrespective of inflation, we have been able to take a 4%-5% price increase year-on-year.”
When competitors entered with similar BLDC fans priced 20% lower, he decided to resist price wars. “If it means losing some growth, so be it. Maybe I’m losing an additional 5% of growth. But if I react, it becomes a race to the bottom.”
“The alternative? If there’s a price war, we’ll increase marketing investment by 1% or 2% instead of trying to reduce the price.”
This pricing strategy is supported by consistent brand communication. “We’ve always been benefit-driven in our messaging,” Arindam explains. “It’s clear — this is a benefit, this feature enables this benefit, this feature is enabled by technology. That’s the reason to believe.”
He emphasizes maintaining a modern, premium look across all touchpoints: “Our ads will always look and feel a certain way. It will always look modern.”
Metrics by Category Maturity
Arindam suggests using different performance metrics for established or new product categories:
Established category (Fans)
For their core fan business (70% offline, 30% e‑commerce for Atomberg), they track traditional P&L with clear profitability targets. Marketing spend is calibrated as a percentage of revenue. “For fans, marketing spends as a percentage of revenues has always been less than 10%.”
While they spend more than competitors (“Our industry is at around 3 – 3.5%. We still have a 5% delta”, says Arindam), the higher margins justify the spends. “Whatever extra we spend in R&D and marketing should be compensated with a higher gross margin. And that gross margin delta should be greater than the addition of these two deltas.”
New category (Mixer Grinders)
For newer categories like mixer grinders (80% online, 20% offline for Atomberg), Arindam suggests focusing initially on revenue above all else. “Without growing revenue, we cannot optimize for anything else.”
This creates a fundamentally different management approach. “For a new category, if we’re at ₹ 4 crores a month, how soon can we get to ₹ 10 crores? And that’s a daily discussion. So, it’s very growth-focused.”
Instead of fixed P&L targets, maintain fluid expectations. “I may be okay to lose 15 – 20 crores this year. But without achieving the top line, it doesn’t make a lot of sense to optimize for anything else.”
While revenue drives day-to-day discussions, Arindam stresses modeling another metric: destination gross margin (i.e., what the unit economics will look like at scale).
“Today my price is this, my bill of materials (BOM) is this, but I know at a hundred crore scale, my BOM will change. At a 300 crore scale, it will change again. So, can I bake it now into my price and cost calculations?”
This long-term view should inform pricing strategy from day one. “If my destination gross margin doesn’t support my current pricing, I should change it.”
This allows for calculated trade-offs in the growth phase: “I take a gross margin hit for the first 2 – 3 years, but can I scale quickly? That’s where the economies of scale kick in.”
When launching in a new category, Arindam says it’s crucial to maintain a “maniacal focus” on PMF indicators. Here are the markers to track:
- Shift in views/impressions from advertising-led to organic
- Monthly improvement in conversion rates
- Monthly improvement in marketplace ratings: Number and value.
Identifying High-Margin Opportunities
Arindam suggests a four-step framework for evaluating new product categories, focused on margin discipline, capital efficiency, and defensibility:
Market evaluation
“First, what is the size of the category? Second, what is the profit pool in the category? Who are the players who own most of the profit pool? And do we have a right to win there?”
Arindam suggests this analysis helps avoid superficially attractive categories: “Many categories seem very lucrative, but if you look at the profit pool, 90% will stay with one or two companies. So there’s a big barrier to entry in that category.”
Capability match
He advises assessing capabilities developed over time. “In the last 7 – 8 years, we’ve built capabilities around three or four core things: Motors, of course, is one very strong capability. Design is another thing and IoT is third. We look at categories where these capabilities give us a right to win.”
Consumer problem identification
Look for unmet needs: “We marry our capabilities with a consumer problem that no one else has solved in the category.”
The mixer grinder example illustrates this approach — while competitors focused on power and speed, Atomberg focused on grinding quality, compactness, and safety. Their BLDC technology provided a unique solution and identified additional pain points in compactness and safety.
Defensibility assessment
This is perhaps the most important step, given how quickly breakout products can be copied. Assess how long your innovation can be protected.
“If you come up with innovation and it gets copied in three months, you don’t have the window of opportunity. Ideally, you need 18 to 24 months to juice out your edge.” This time builds brand association: “By the time someone copies, you’ve built a top-of-mind presence for your innovation, so that whenever someone else comes along, they look like a me-too.”
Go Deeper Than Surface Metrics to Solve Problems Efficiently
Instead of broad interventions for marketing and sales performance issues, Arindam advocates for a methodical diagnosis to prevent wasteful spending. “You have to dive deeper into the metrics to find the problem,” Arindam explains, using e‑commerce as an example.
“Take e‑commerce. At the top-most level, we look at sales. But what drives sales? It’s traffic multiplied by conversion rate multiplied by average order value. If there’s a problem with traffic, we break it down into organic and paid traffic. If paid traffic is the issue, we drill down even further to examine traffic from different sources like Meta, Google, and others.”
“If it’s a conversion problem, we’ll tweak pricing, proposition, or messaging,” explains Arindam.
This approach extends across channels. For offline retail, he explains, when facing declining repeat purchases from retailers, it’s essential to investigate whether the issue is a margin structure, inventory, or pricing problem before trying solutions.
“The faster you identify the exact problem, the less capital you waste trying different solutions,” explains Arindam.
The evolution of performance vs. brand marketing
Arindam shares how the marketing mix typically evolves with scale, shifting from performance-focused tactics in the early days to a greater emphasis on brand building as the company grows. This strategic shift helps build long-term defensibility and supports premium positioning, which reduces customer acquisition costs (CAC) as you scale.
“Till about ₹ 150 crores, it was a 100% performance. From 2021 onwards, brand spend started increasing. Maybe year one, it was around 25%. Now, it’s around 40 – 45%.”
He clarifies that this isn’t just a simple split between awareness and conversion. Other elements factor in: “The rest will not be pure performance. There will be a component of trade marketing, which will be around 15%. And a content creation component, around 5 – 6%.”
Arindam advises adopting a nuanced definition of performance marketing: “How a lot of people define performance makes me uncomfortable. For me, performance is benefit-driven communication, targeted to people who are in-market to buy that category. And not ‘buy now, 40% off’, ‘buy now, 50% off’. That’s a sub segment, but we don’t do a lot of that.”
This philosophy means performance campaigns can contribute to brand building. “80% of our performance spend is also benefit-led communication targeted towards the in-market audience,” Arindam notes.
Protect Your Core Investments
While Atomberg optimizes aggressively in many areas, Arindam says founders should find 1 – 2 core areas where they won’t compromise. For Atomberg, these are brand and R&D investment.
He acknowledges that R&D is often seen purely as a cost center. “It’s a significant chunk of our manpower cost. But since we’re investing a lot in tech and the future, and we’re not optimizing say just for this financial year.”
He suggests justifying these investments through the resulting margin improvements. “If your competition spends x% in R&D and I’m spending x++%, my gross margin should be accordingly higher. If my products delivers a higher gross margin by spending more in R&D, all costs are justified.”
His framework for prioritizing such investments hinges on urgency and competitive dynamics: ”If something is not fundamentally changing in the market in 12 months, we can delay it. But if we believe that someone else can seize this opportunity if we don’t act now and wait 12 to 18 months, we prioritize it.”
Building a profitable consumer durables business comes down to having clear first principles, Arindam suggests. These include:
- Maintaining financial discipline from day one by tracking operational EBITDA
- Identifying 1 – 2 core areas like R&D that can’t be compromised, even if they appear as cost centers initially
- Having a clear view of destination margins before entering any category
- Using systematic diagnosis to prevent wasteful spending
- Understanding when to shift from pure performance to brand building
These principles helped Atomberg reach ₹ 1000 crore while improving margins, but more importantly, they offer a framework for other consumer durables founders to approach the challenging balance between growth and profitability.
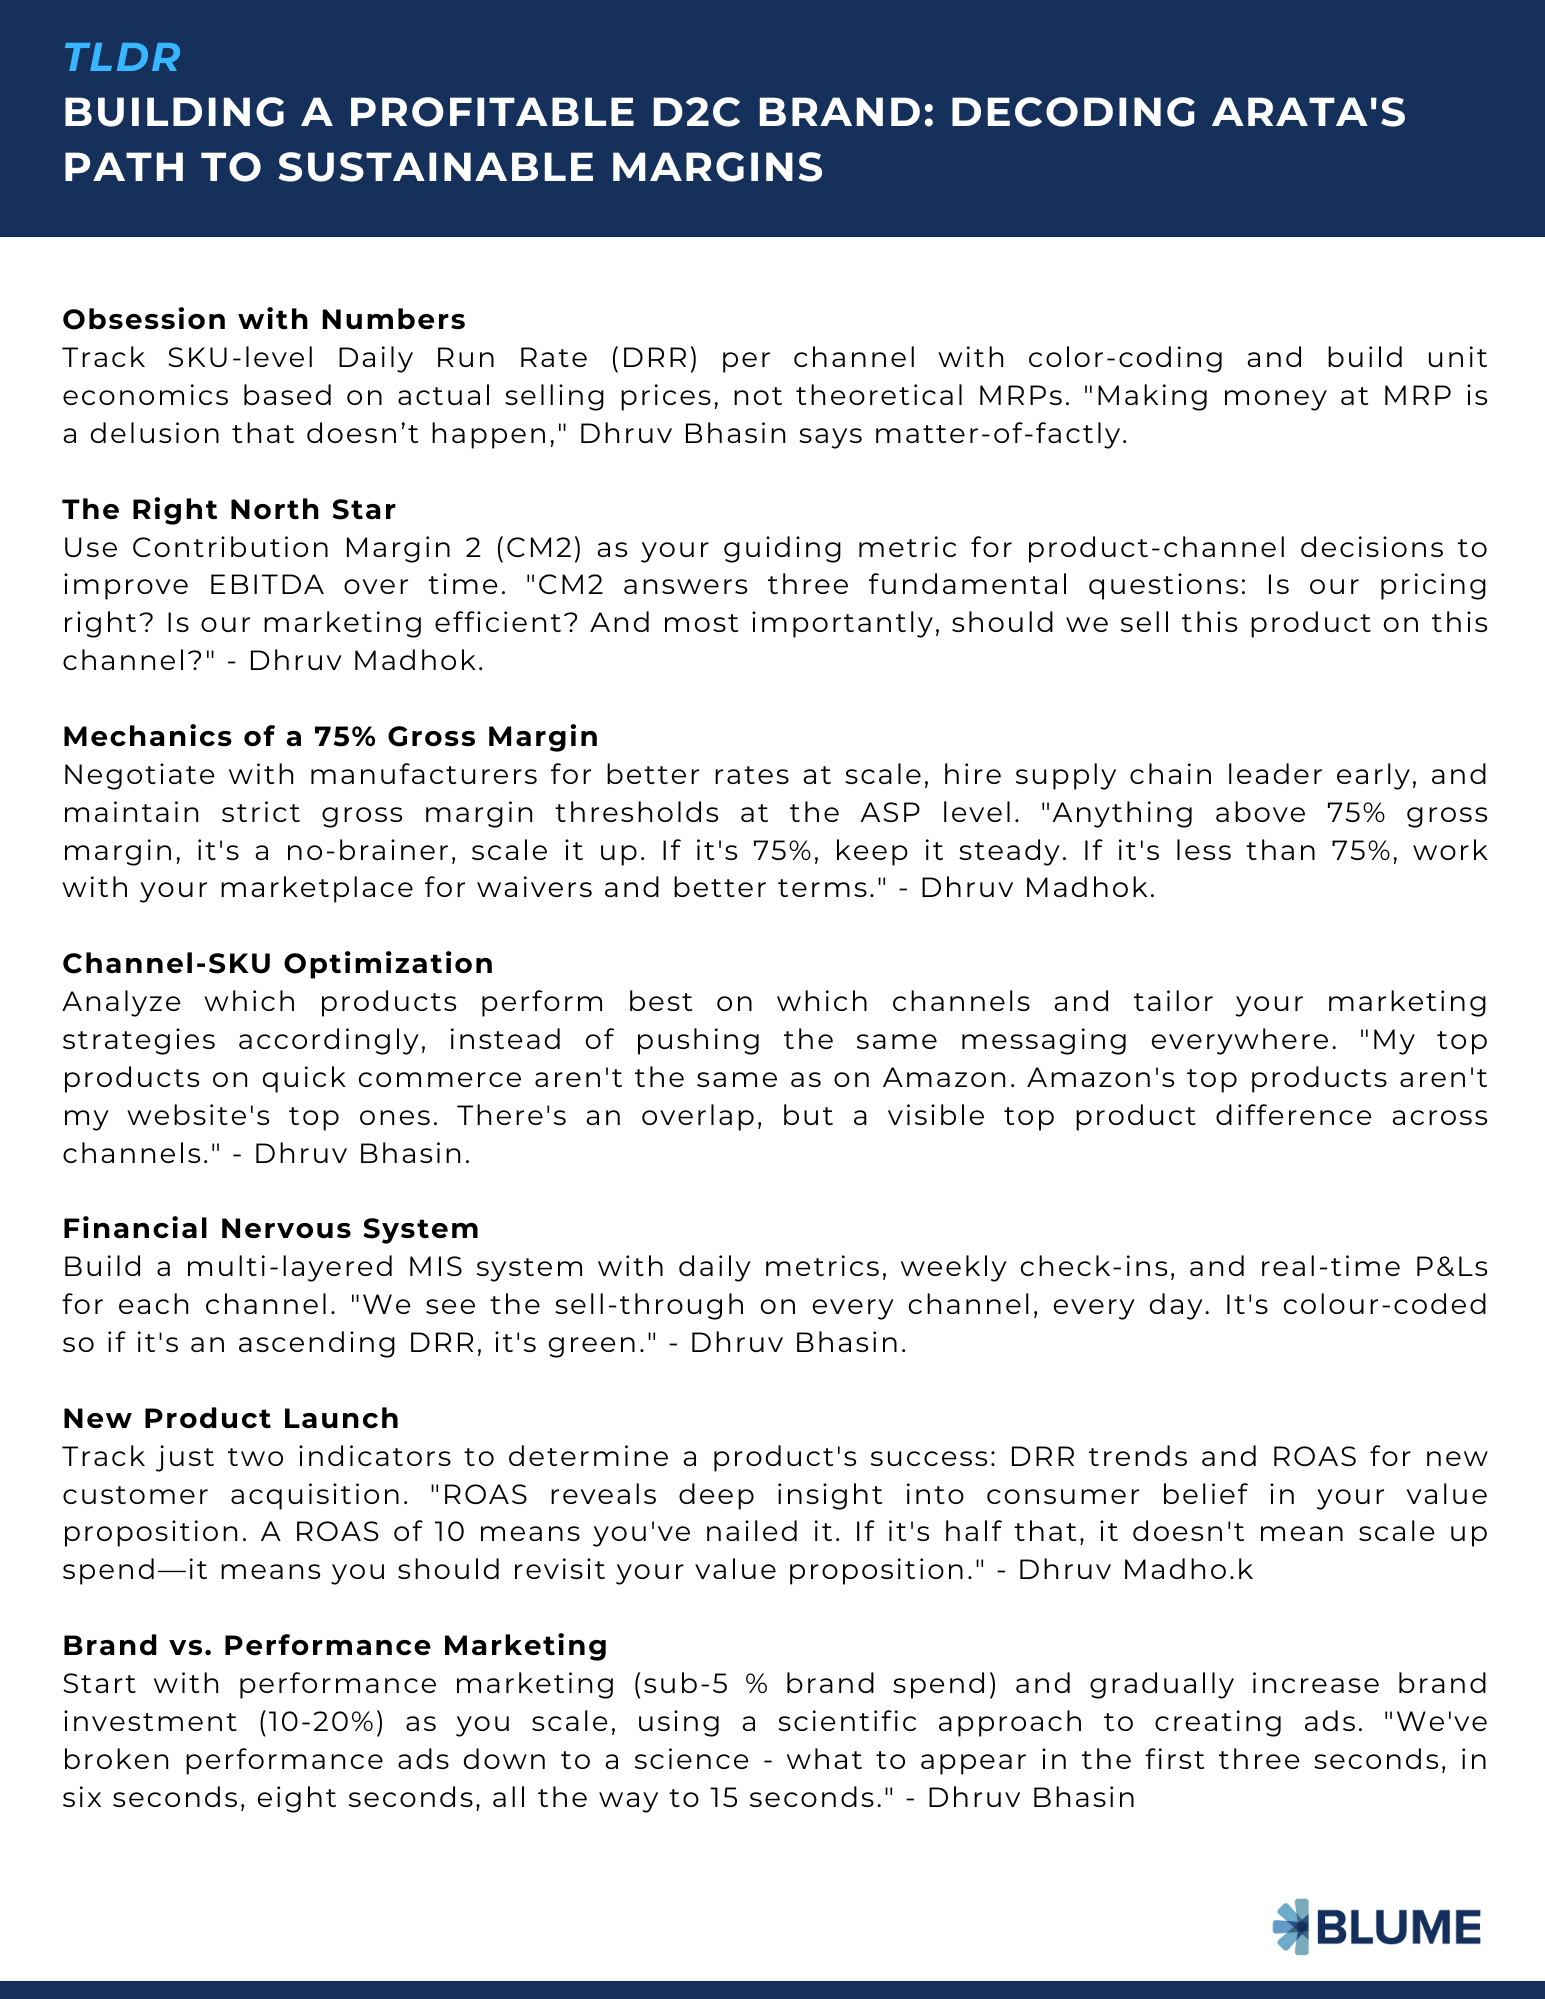
TLDR
Here are the TLDR one-pagers for all three case studies.


Commentaries


Building AOPs That Work: Real Lessons from Seasoned D2C Founders
Discover how seasoned D2C founders Romita Mazumdar (Foxtale) and Abhishek Agarwal (Farmley) built ₹400 crore consumer brands using comprehensive annual operating plans as daily operating systems. Learn proven, practical frameworks for…- Current Section
- Commentary
- Sector
- Commerce & Consumer Brands
- Authors
- Rohit Kaul
- Published

Growing Organically on Instagram: An Anti-Playbook for D2C Brands
You are a D2C brand with a fantastic product that’s different from anything else in the market. You know people will love it, if only you can get them to try it. But how do you reach them? It’s going to take a while to get listed…- Current Section
- Commentary
- Sector
- Commerce & Consumer Brands
- Authors
- Gowri N Kishore
- Published

ConsumerTech Playbook
Building a ConsumerTech business doesn’t have to be complicated! With this belief, Marmik Mankodi and Nachmmai Savithiri have created Blume’s ConsumerTech Playbook—a practical guide designed…- Current Section
- Commentary
- Authors
- Marmik Mankodi, Nachammai Savithiri, Rajat Garg
- Published

Driving performance via influencer marketing
As a consumer-tech investor at Blume Ventures, I often speak to founders who find it difficult to measure the performance of influencer videos effectively. While influencer marketing is a hard-to-measure channel, it is also increasingly…- Current Section
- Commentary
- Authors
- Marmik Mankodi
- Published