Things to keep in mind while starting or scaling performance marketing

- Published
- Reading Time
- 12 minutes
- Contents

I oversee consumer apps investing at Blume Ventures. Prior to joining Blume Ventures, I ran performance marketing & growth at Mosaic Wellness & Rebel Foods wherein I used to handle a budget of over Rs 3 crores/month. In my new avatar, I end up speaking to a lot of founders who are new to performance marketing. To help founders like them & their marketing professionals, I have written this piece, which you can think of as a primer on performance marketing. This is tailored for anyone who is taking their first leap into using performance marketing for driving conversions. I do think that some parts of it will be useful for experienced professionals as well.
In this article, I’ll cover how performance marketing works & the most common metrics that one should track, along with how to address the most common anomalies. I hope that by the end of this article, you'd be equipped with the tools needed to make informed decisions around performance marketing and achieve measurable results.
Acquiring New Users Digitally
Advertising your product or platform digitally is often the quickest way to acquire users and drive growth for your business. Some of the ways are:
- Run ads on Meta (FB, IG, Whatsapp)
- Run ads on Google (Search, Performance Max, Universal App Campaigns, etc)
- Tie up with distribution channels like Google Pay, Phonepe, CRED, etc & share coupons with them
- Tie up with influencers who will promote your products on YouTube or Instagram
- Tie up with affiliates & other ad networks to promote your products
While there is no way to know which channel would work for you the best, I will be covering a primer on how to think about running Meta + Google ads in this note.
We will first cover how performance marketing works, then the incentive structures and finally we will move on to metrics and anomalies.
How Does Performance Marketing Work?
Digital media acts as a three sided marketplace where there are platforms (Facebook, Youtube, Instagram, etc) at one end, users at one end & advertisers at the other end. The incentives for users, advertisers & platforms are aligned in the following way:
User incentives: The ad platform wants users to spend more time on their platform so that they can show more ads to the user. That can only happen if they consume relevant content, including ads.
Advertiser incentives: The ad platform wants advertisers to spend as much money as possible on their platform. This would only happen if the platform is able to give the advertiser the sort of results it wants. To ensure that they have enough indicators of performance on our website/app, the ad platforms have their own tracking pixel / Software Development Kit (SDK) integrated, using which it can collect user data on our platforms
Here’s a chart of how the user-advertiser flywheel works.
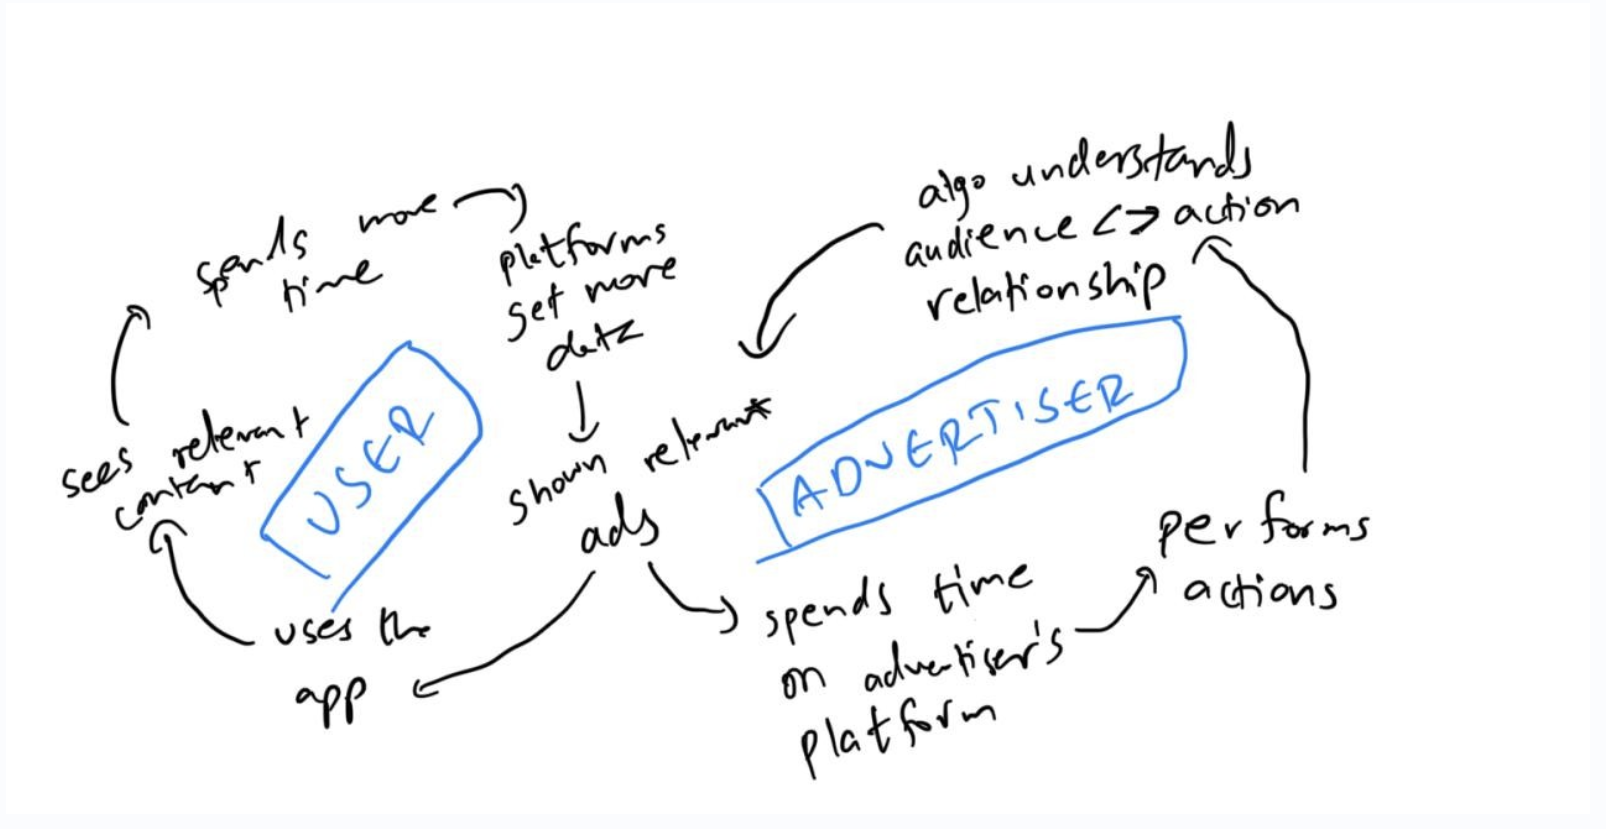
Platform incentives: Between the user & advertiser lies an algorithm which carefully balances the thread by ensuring that the user’s seeing relevant ads and the advertiser is getting relevant actions. The algorithm places a real-time bid on each user & ends up spending our budgets accordingly. The platform wants the advertiser to spend their maximum marketing dollars & users to spend maximum amount of time on their respective platforms
As an advertiser, the job to be done is to ensure that the correct conversion goals are set while showing ads that a user wants to see on their feed. On doing so, advertisers end up having ~100% control on where the marketing dollars are being spent.
Before you make the first few iterations of your creatives, it is also important to understand who these creatives would be targeted to.
What are the different audiences & how do they work?
Audiences can be broadly classified into 3 segments
- Demographic-based segments - One can add: age, location, gender & a few other deterministic demographics (phone used, network provider, etc) & target users
- Interest-based segments - Meta & Google classify you using their proprietary data algorithms into a few interest groups. You can view your own preferences by going to these links - Meta & Google
- AI-generated audiences - There are campaign objectives in Google & Meta panel wherein an advertiser just has to put a landing page & ad copies; their AI does the rest of the job of finding audiences that are likely to perform your desired actions
Eg: a store that sells men’s graphic t-shirts in India for F1 fans would choose the following targeting criteria - Men, of age 18-45, who like F1 or sports car or graphic tees. The reason I’ve set an upper limit of 45 is that I do not believe that people over the age of 45 are very likely to wear graphic tees. Apart from F1 enthusiasts, I’ve also added sports car enthusiasts as an interest group because it is not necessary that Meta/Google would have classified everyone who likes F1 correctly. Sports car is a good adjacent category to target, as is people who have shown interest in graphic tees.
Now that you’ve made your audience and uploaded the creatives, let’s dig into the metrics that you need to track periodically.
Metrics to observe
We’ll start with metrics to view for websites & then look at the couple of extra ones that are more app-specific
Metrics To View On Ads Platform Panel For Website
- Amount Spent: Self-explanatory
- Reach: Number of unique users reached
- Impressions: Number of times your ad has been served to users
- Cost Per Mille (CPM): Cost per 1000 impressions; gives us an idea of how much money it takes to serve an impression of the ad to a user
- Frequency: Impressions / Reach – # of times a user sees our ad on an average. It's important to ensure that the frequency of ads does not increase as we want to ensure that:
- Users don't get bored of seeing our ads
- We consistently reach out to newer audiences
- Link Clicks: # of people clicking on the links placed on our ads
- CTR (Link Click Through Rate on ads platform) - Link clicks / Impressions – % of people clicking on our ads. This is an important metric to track because
- It gives us an idea of whether the ad we are running is resonating with our audiences
- It gives us an idea of the type of content our potential users want to consume
Please note that CTRs should be benchmarked against the CTR of ad placement (i.e. reels, feed, etc.). You will observe that placements like Instagram feed & google search have a higher CTR than reels, stories, YouTube shorts, etc
- Landing Page Views (LPV) - # of people that actually landed on our website after clicking on the ads
- LPV / LC % - Landing page views / Link Clicks – % of people who click and reach our website. We want this number to be above our benchmarks for the ad placement in question
- Add to carts (ATC) - # of people choosing to add the product to cart
- ATC% - ATC/Link Clicks. This is an important indicator that indicates the quality of our audience. Sometimes the ATC% might be low because there is an inherent problem with our website but that’s a black swan event.
- Purchases - # of purchases that are driven by our ads acc to the ad platform
- Purchase % - Purchases / ATC; considering that the funnel till ATC is alright & if you’re seeing a drop in purchase %, it's an indicator that something is wrong with our checkout page.
Experienced marketers keep this framework in mind:
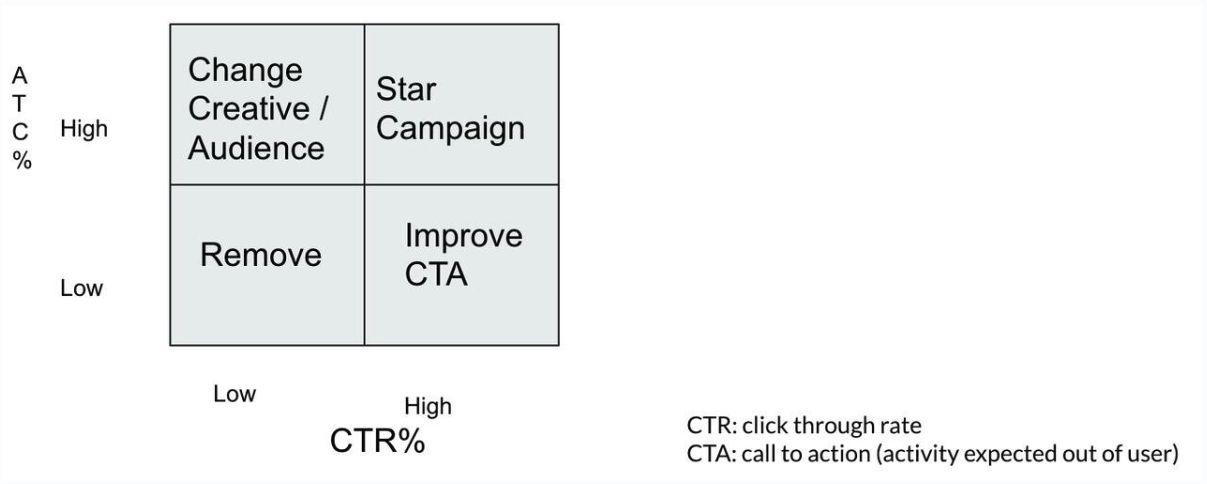
CTR needs to be benchmarked by placements
Low CTR% + Low ATC% - These ads need to be shut down
Low CTR% + High ATC% - The messaging on the creative or the audience is not right here owing to which less people are clicking on the ad but the ones clicking are converting at a higher rate
High CTR% + High ATC% - These are the star ads. No action is required here
High CTR% + Low ATC% - In such cases, the ad is hitting the sweet spot but the Call To Action (CTA) on the website/app is not clear. So, we need to change the Call To Action
Metrics To View On On Ads Platform Panel For App
All the metrics that impact acquisition on ads platforms apply here as well. Do note that instead of taking users to the website, we are taking them to the Google Play store or the iOS App store where they end up installing our app. Once they install the app, we measure the same metrics again. The metrics that differ for app acquisition are:
- App Installs: # of people installing the app after clicking the ad
- App Installs % - Installs / Number of Clicks – the % is a direct indication of the quality of our App store or Play store listing. Considering that these stores are highly guarded, a sudden drop in App Installs % is an indicator of the audience quality
Note: Meta & Google are Self Attributing Networks. Hence it is better to rely on attribution tools and your attribution model for calculating the actual number of new users. Which brings me to the next segment. What exactly is an attribution model? Why does it matter?
Attribution Models
In an attribution model, you’re trying to figure out what actions led to the final conversion/sale. It matters because otherwise, you have no way of knowing what marketing actions led to the sale. If you don't have a reliable attribution model, you don’t have a way to remove what is not working and double down on what is working.
There are 2 overarching attribution models on the basis of the attribution window:
- View Attribution: Only possible to do so on an ad platform. The user’s activity gets attributed to the ad viewed by them
- Click Attribution: The user’s activity on our website/app gets attributed to their click
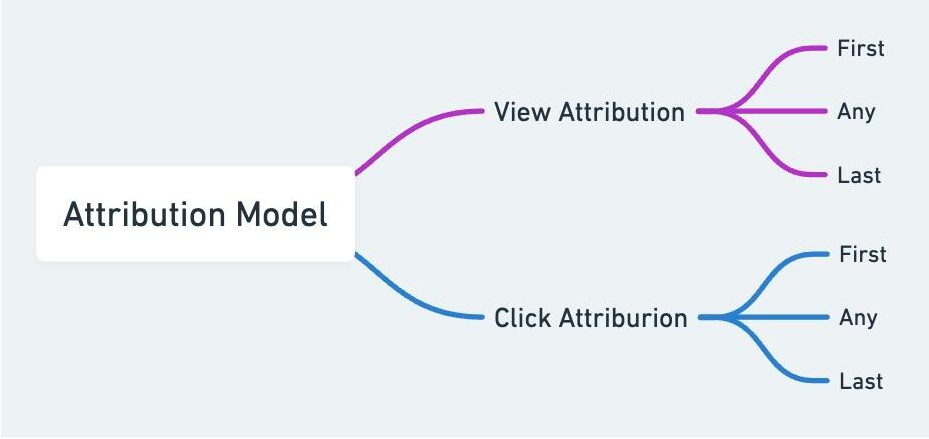
These get further broken down to:
- First click - A user gets attributed to the first ad campaign that they clicked from
- Any click - A user gets attributed to any ad that they have clicked:
- Last click - A user gets attributed to the last ad that they clicked:
Imagine a user, Sarah, who is in the market for new running shoes. She begins her journey by scrolling through her Instagram feed, where she sees an ad for your e-commerce store showcasing a new line of running shoes. Sarah is interested and clicks on the ad to learn more. She browses through the selection but doesn't make a purchase immediately. Later that day, she saw a sponsored post on Facebook featuring a discount code for your store. Remembering the shoes she liked earlier, she clicks on the Facebook ad and decides to make a purchase.
Now, let's analyze Sarah's journey using different attribution models:
- First Click Attribution: In this model, the credit for the conversion (purchase) would go to the first interaction Sarah had with your ads, which was the Instagram ad. So, the Instagram ad would receive full credit for the sale.
- Any Click Attribution: With this model, any interaction Sarah had with your ads would receive credit for the sale. Since Sarah clicked on both the Instagram ad and the Facebook ad before making a purchase, both ads would share the credit equally for the sale.
- Last Click Attribution: In this model, the credit for the conversion goes to the last interaction before the purchase. Therefore, the Facebook ad would receive full credit for the sale, as it was the last ad Sarah interacted with before making the purchase.
Each attribution model provides a different perspective on how credit is assigned to marketing touchpoints. In this case, choosing between these models could impact how you allocate your advertising budget and evaluate the effectiveness of your marketing campaigns.
First click attribution is very useful when we are running a high-frequency brand marketing campaign. In the beginning of a brand’s journey, last click proves to be a better attribution model as that is the standard attribution used on Google Analytics & ad platforms. Any click attribution is not something that a lot of brands use because of its ambiguity. This is what attribution looks like on Google Analytics which uses last click attribution:
Now that you have figured out the broad metrics to look out for and different attribution models, let me take you through problems that you will face & how to navigate them in your day to day execution.
Frequently Occurring Anomalies
Why is my CPM going up or down?
CPM (Cost per 1000 ad impressions) is a function of quite a few things, 99% of them are noted below:
- Placement of the ad - a few placements are more expensive than the others
- Audience characteristics - a few audiences are more expensive to reach than others as a lot of advertisers compete to serve their impressions to them
- Audience size - the smaller the audience, the higher the CPM as the algorithm has to place a higher bid to serve our ads
- Creative / audience fatigue - you have served the ad multiple times to a user despite them not converting which further increases your bid
When CPMs go up, you’d want to check:
- Where your ad is placed (reels/feed/stories, etc.) - Some ad placements are more expensive than others. If spends shift from IG reels to Feed, you might see your CPMs increase as Feed is typically more expensive. Refer to the next step if you do not see an anomaly here
- Seasonal events - Amazon, Flipkart, Nykaa, etc. go on sale twice a year. CPM increases then. Also, CPMs tend to be higher during festivals. In such scenarios, you should reduce budgets wherever possible
- Frequency of the ad set - There’s no mathematical formula on what is an ideal ad set level frequency, but alarm bells should start ringing when it crosses a frequency of 6 in a month as the platforms have stopped serving your ads to new users by now
Why is my CTR going up or down?
CTRs and its anomalies are a function of the following factors:
- Creative quality: You’d want to ensure that the quality of creative is really high & on par with the category guidelines; while it's okay to be cheesy or witty in your creatives…always have a close eye on conversions
- Creative audience match: You’re showing your ads to the wrong audience. I might make an A1 creative with a Formula 1 reference but only 1M people watch F1 in India, so I’m never going to get a good CTR
- Landing page quality & relevance: Your landing page should not take a user by surprise. If we’re advertising for Air Jordan sneakers on our ad, we should send users to a page that has Air Jordan sneakers in it. If the landing page is irrelevant, the ad is served to an irrelevant audience as well
- Conversion quality: When the # of conversions is lower, the algo goes on an overdrive & tries to serve your ads to a lot of random audiences which will lead to much lower CTRs
As a rule of thumb, always serve ads that look like a piece of content that a user is going to organically see on their feed.
Why is my Landing Page Views (LPV) / Link Clicks (LC) going up or down? This could also extend to drop in app store listing viewed to app downloaded
LPV / LC drops in the following cases:
- The ad is driving a very low quality audience to our platform & this is not going to help us in any meaningful way
- Our website page is taking too long to load & users are dropping off
There is never one clear for why this metric drops. One way to quickly eliminate tech glitches is by pasting the ads URL on Google Page Speed Insights; if there are no red flags on this, the drop is caused by a poor quality of audience
Why is my Add To Cart (ATC)% too low or high?
Common reasons for anomalies in ATC from ads are:
- Always check if the # ATC is dropping or increasing with your in-house analytics tool. If there’s a significant change on ads platform as opposed to your inhouse analytics tool, something is amiss on the ad platform’s pixel / SDK & needs to get fixed via tech team
- Irrelevant creative - irrelevant creatives bring audiences with lower intent to purchase from our platforms
- Checking ATC on Instagram, FB browsers - IG & FB use a native browser inside their app. To ensure that our page is behaving properly, send an ad to yourself on IG or Facebook and see if the ATC working on the app’s browser
- Bad conversions - when the conversions drop, the algorithms cannot optimize owing to which it reaches out to random audiences with lower intent in an attempt to strike gold
If it’s none of the above, just wait it out for a few hours. If needed, change the creative and let a new one begin its learning journey.
Finally, do ensure that you are not paying the price for payment gateway failures.
Parting Notes
Thank you for making it this far. I hope that the note helped you think through your performance marketing strategies and improve your daily ops.
Quick recap - this primer broadly covered:
- How performance marketing works & how the incentive structures are aligned for brands, partners & their consumers
- The different audience types that can be targeted via performance marketing
- The metrics that need to be observed periodically to stay on top of campaign performance
- Frequently occurring anomalies and frameworks to course-correct
You can write your feedback on the comments or reach out to me at marmik@blume.vc; I would be happy to cover more topics or any of these in detail. Feel free to share ideas & suggestions
Thanks to Sajith Pai , Rohit Kaul and Shreevar Chhotaria for helping me write better.