Indus Valley Annual Report 2024


- Published
- Reading Time
- 1 minute
- Contents
In case you landed here looking for Indus Valley Report 2025, head here: bit.ly/indusvalleyreport2025
We are delighted to announce the 2024 edition of the Indus Valley Annual Report! The report identifies key themes, patterns and trends in the Indian startup and venture ecosystem through 150+ insightful and provocative charts. For those of you who are wondering, Indus Valley is our moniker for the Indian startup ecosystem, or the Indian Silicon Valley.
In 2022, we launched the first edition of the Indus Valley Annual Report. The first edition covered the rise and evolution of India as a startup superpower and the rise of Indus Valley including a look at the key drivers behind its rise. In the second edition, we delved deeper into Indus Valley’s soft power and the many nuances of the Indian startup ecosystem. Now, in this third edition, we unpack the different narratives shaping India, cover how Indian private and public markets have performed, and hint at the trends going forward.
In this piece, we give you a glimpse into the report and cover the key highlights. Think of it as an appetizer that will whet your appetite for the main course, or the full report, which can be accessed here — Indus Valley Annual Report 2024
You can find the previous two editions here — 2023 and 2022.
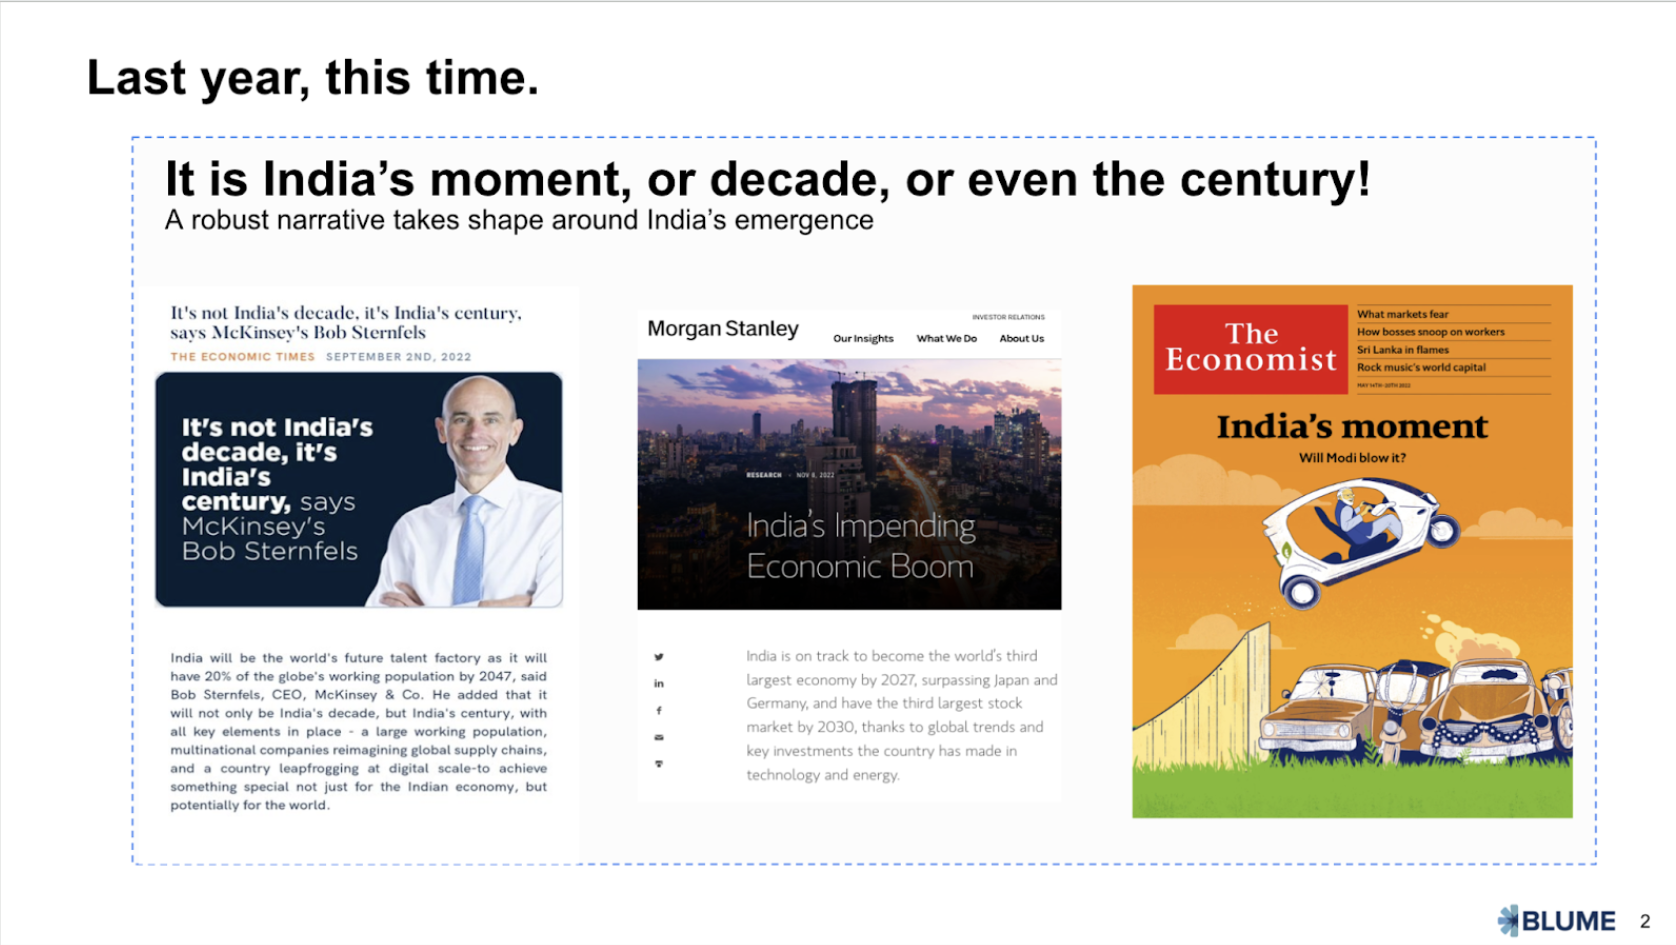
Thanks to COVID and China’s rising differences with the West, as well as the uptick in growth, India’s emergence as the next economic power became a mainstream sentiment. Global publications like The Wall Street Journal, The New York Times, and The Economist captured this mood in their stories.
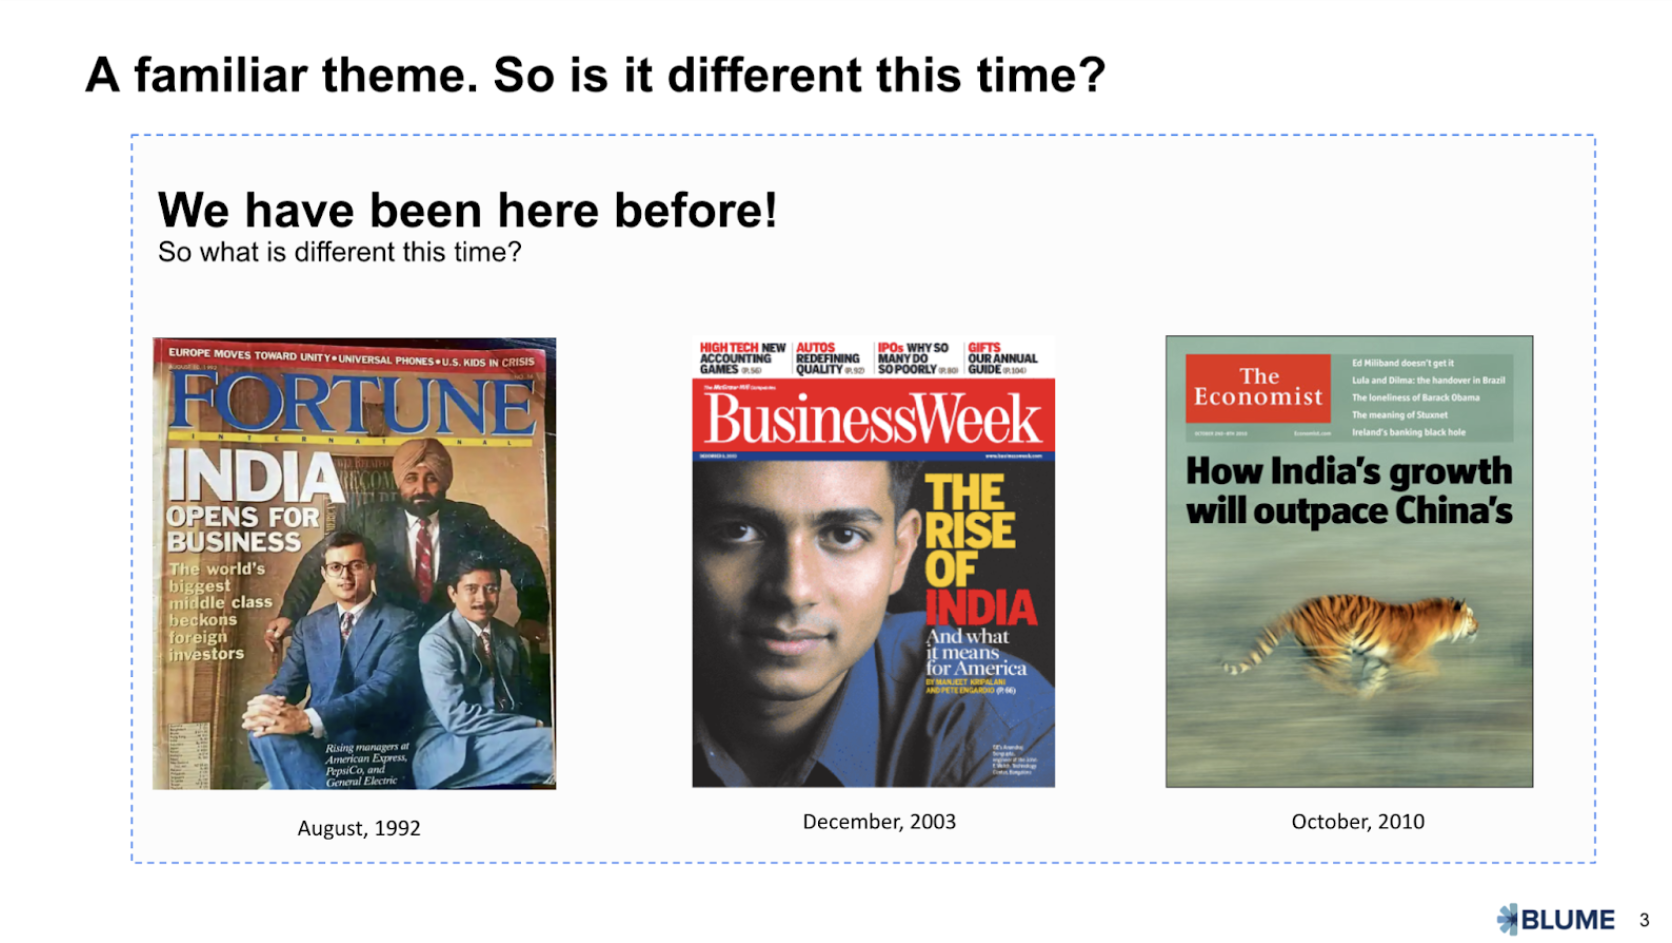
But we also cautioned that this has been a popular theme across the past three decades as well. So what makes it different this time? And, has India’s moment truly arrived?
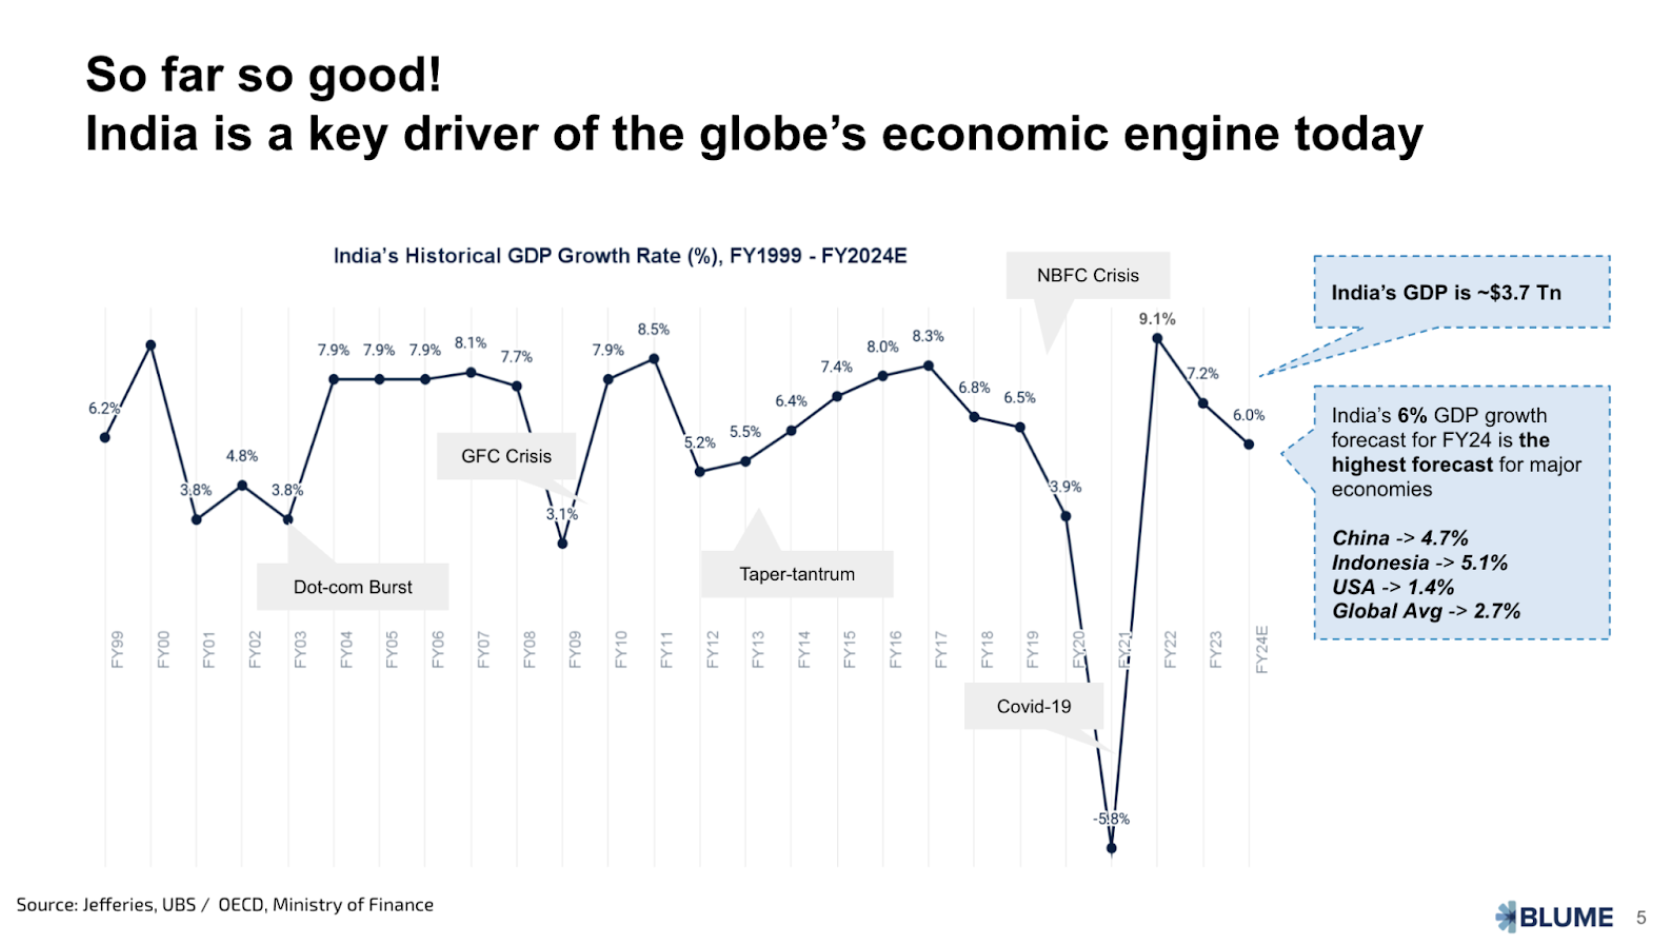
When we look at the GDP growth data, we see that we have done well. We are the fastest-growing large economy at 6% annually (perhaps a bit more; we are awaiting conclusive data), and this trend looks like it will continue.
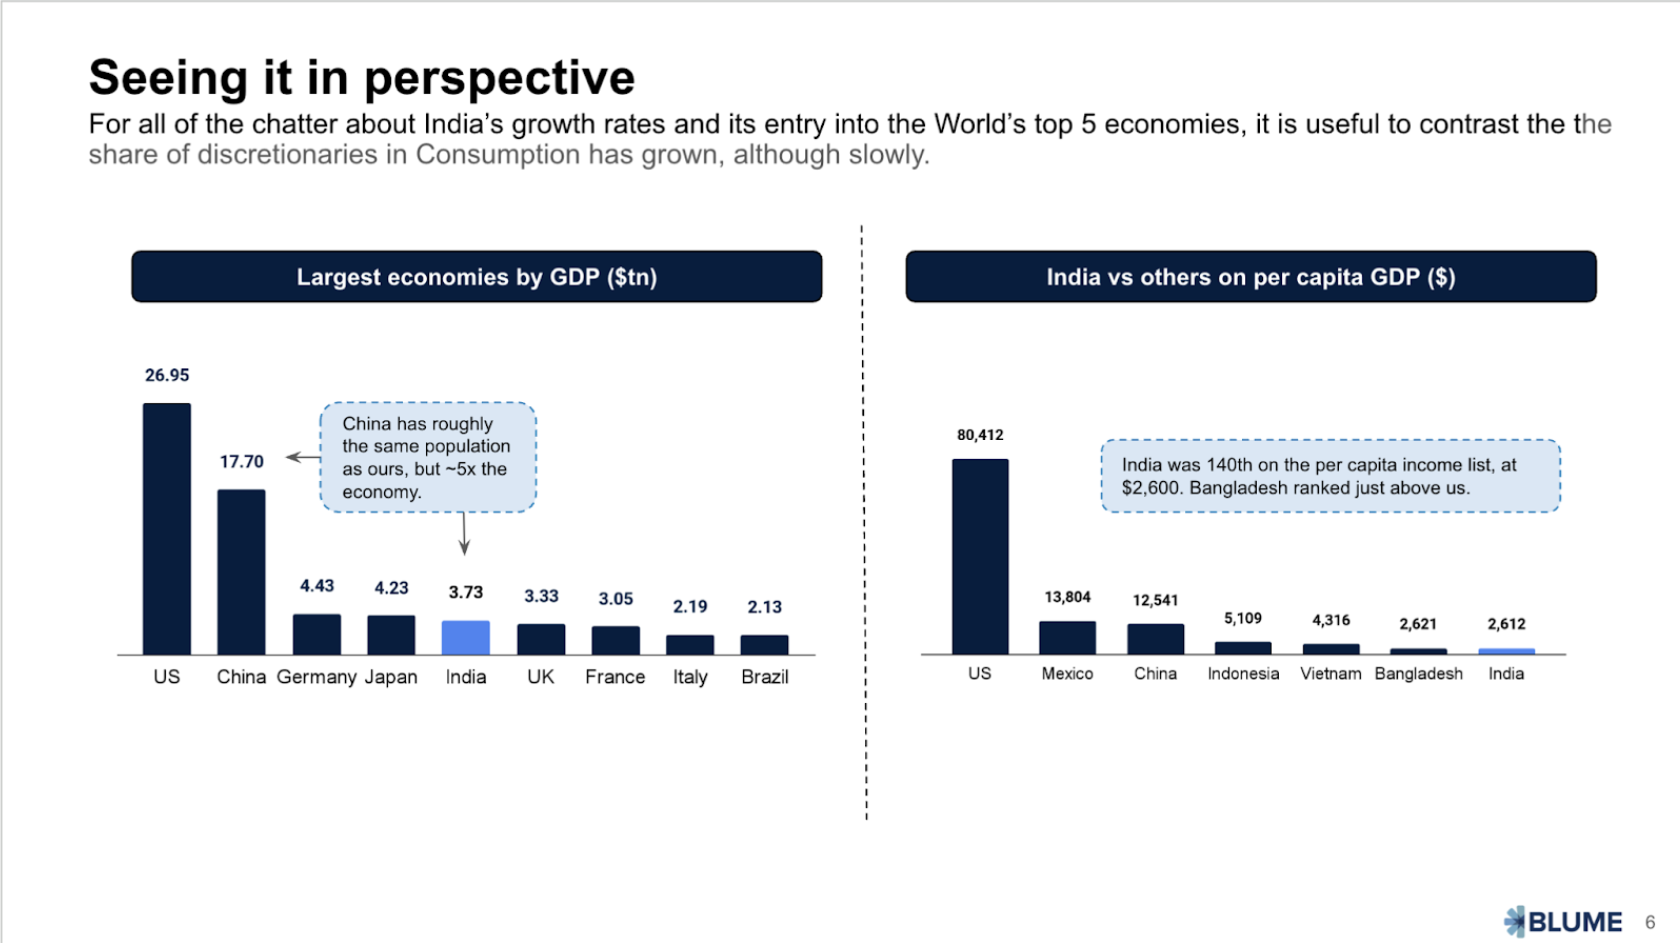
Do keep in mind that while we are the fifth largest economy so far as GDP goes, we are 140th in terms of GDP per capita — in fact, lower than Bangladesh, our neighbour.
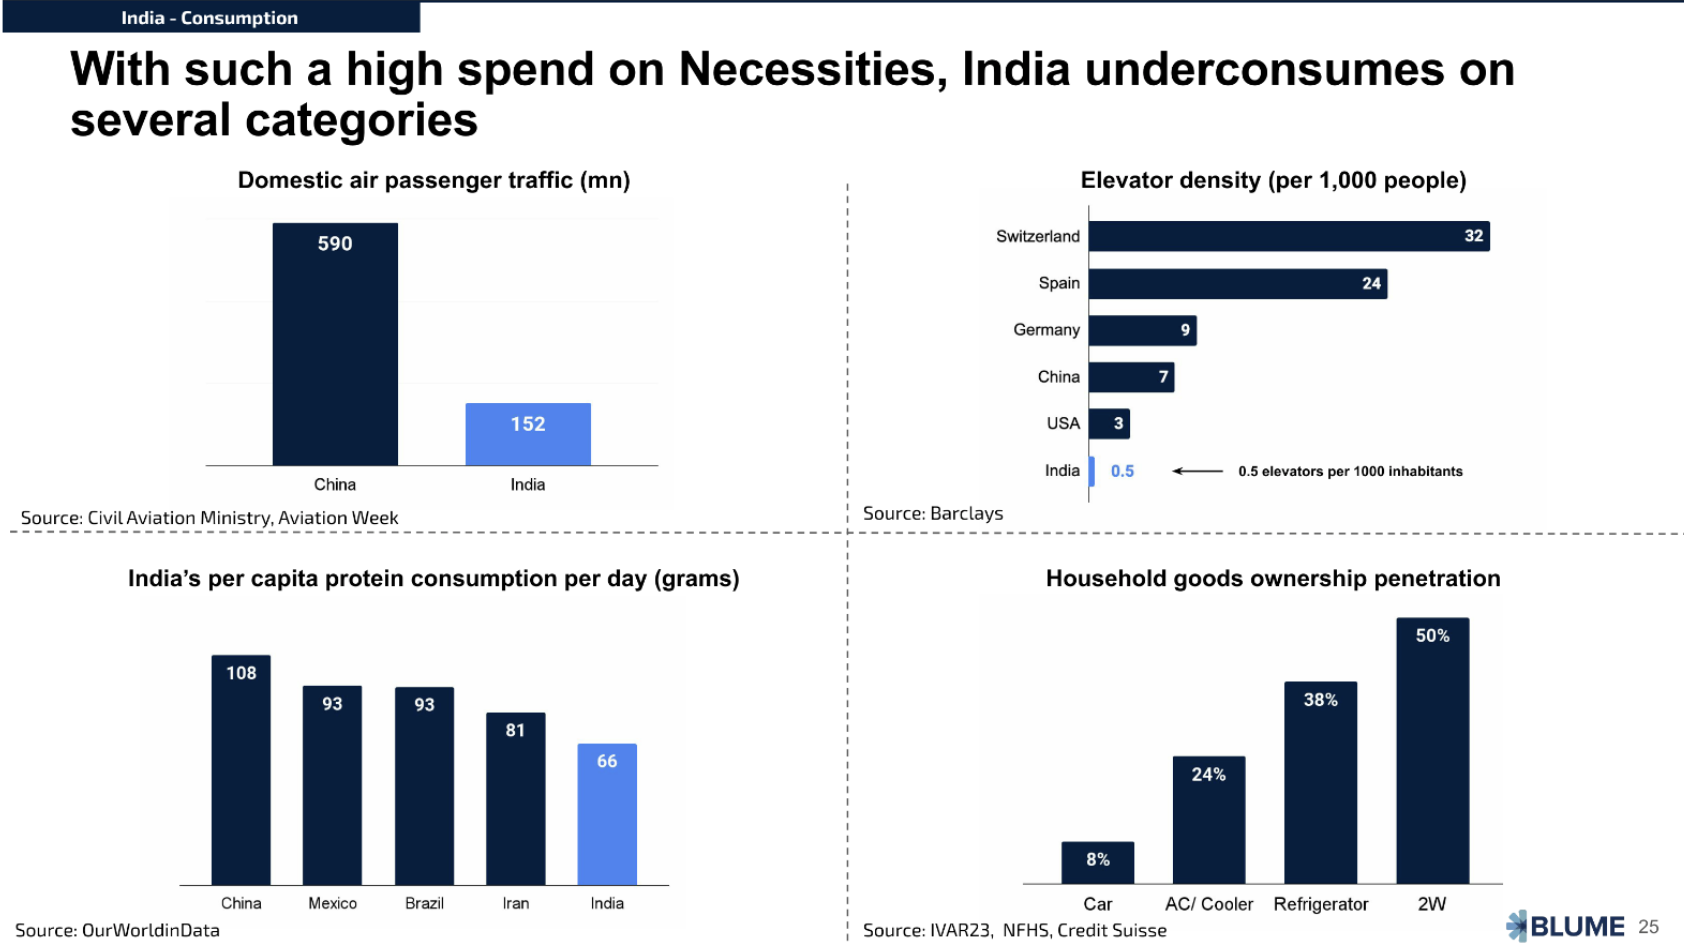
The low per capita means that India underconsumes on several fronts, resulting in low penetration of many household goods. For instance, just 8% of Indian households have cars, and if we look at ownership of TVs, washing machines, and refrigerators, only 16% of households have all three.
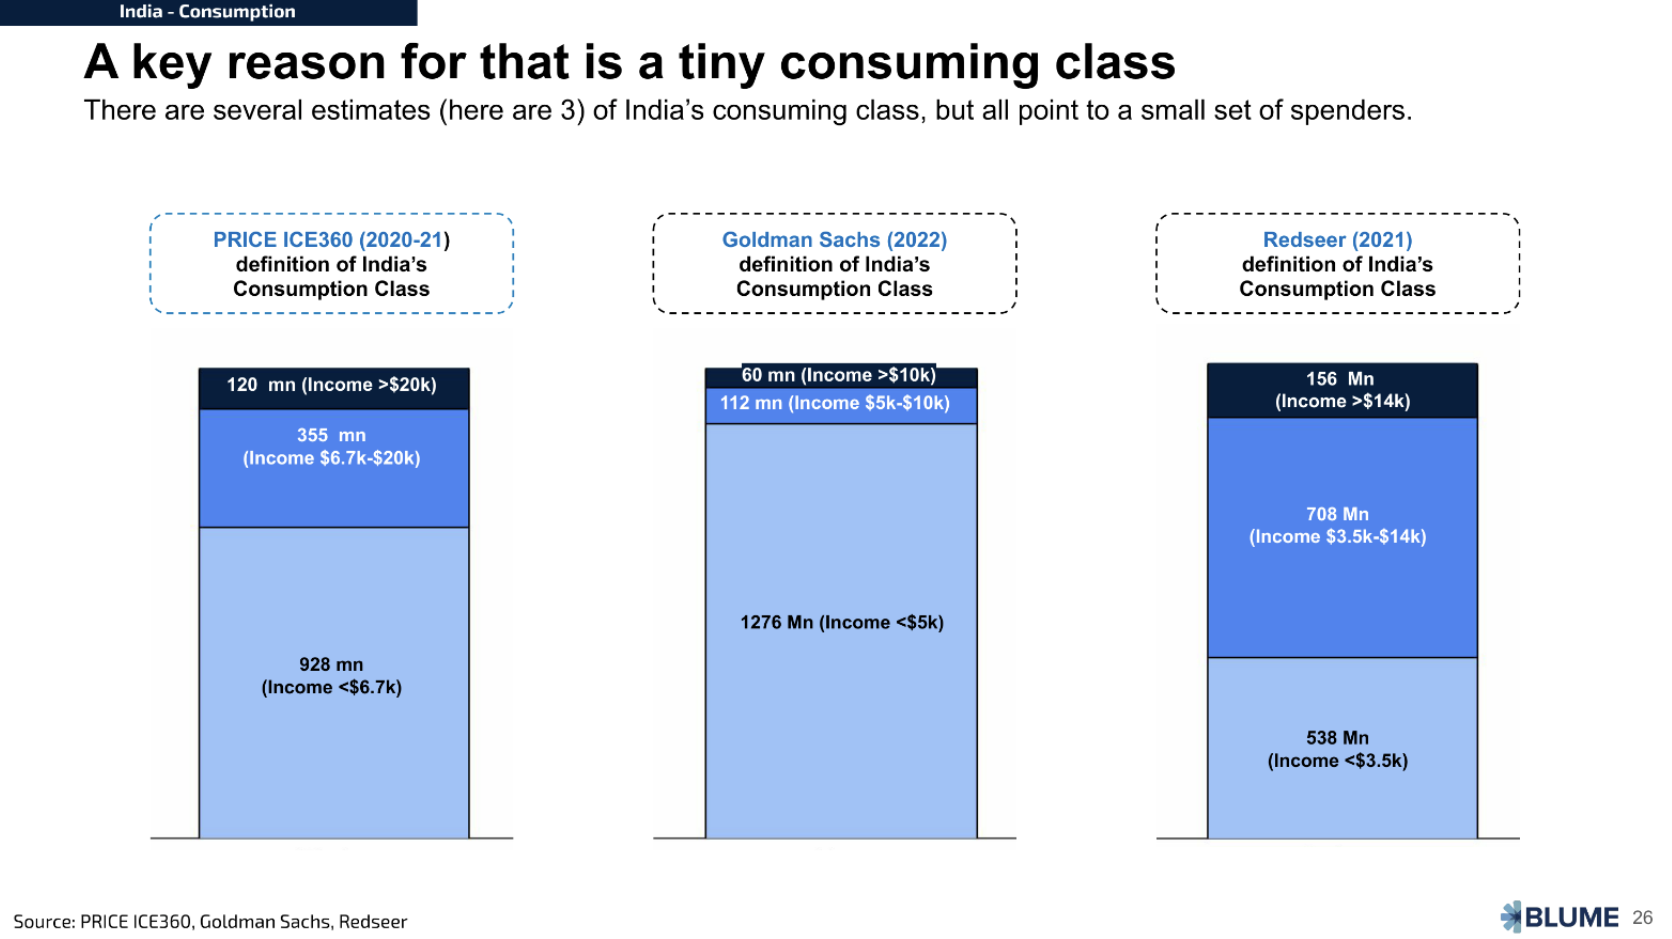
When we segment India’s population on income, basis different data sources, what stands out is how small the Indian consuming class is.
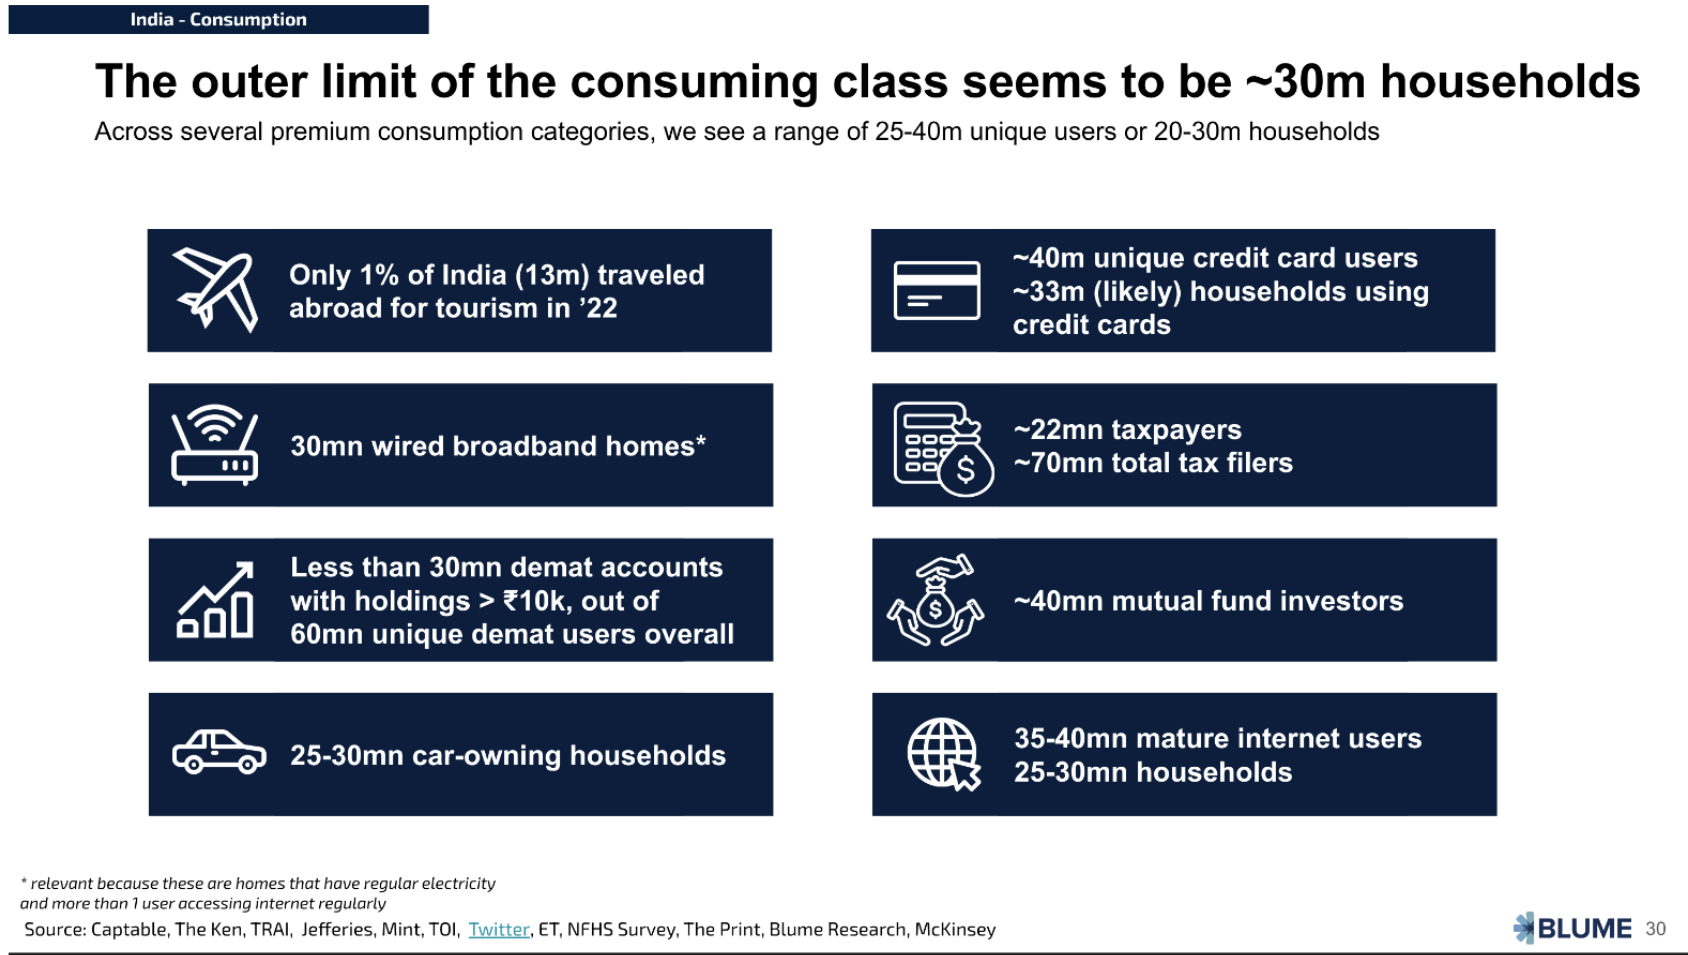
We put together different data points around consumption. It is interesting how many of these settle around 30 million households as the consuming class. We term this the Rule of 30 and believe that the outer limit of the Indian consuming class is ~30m households, about 10% of the total number of Indian households!
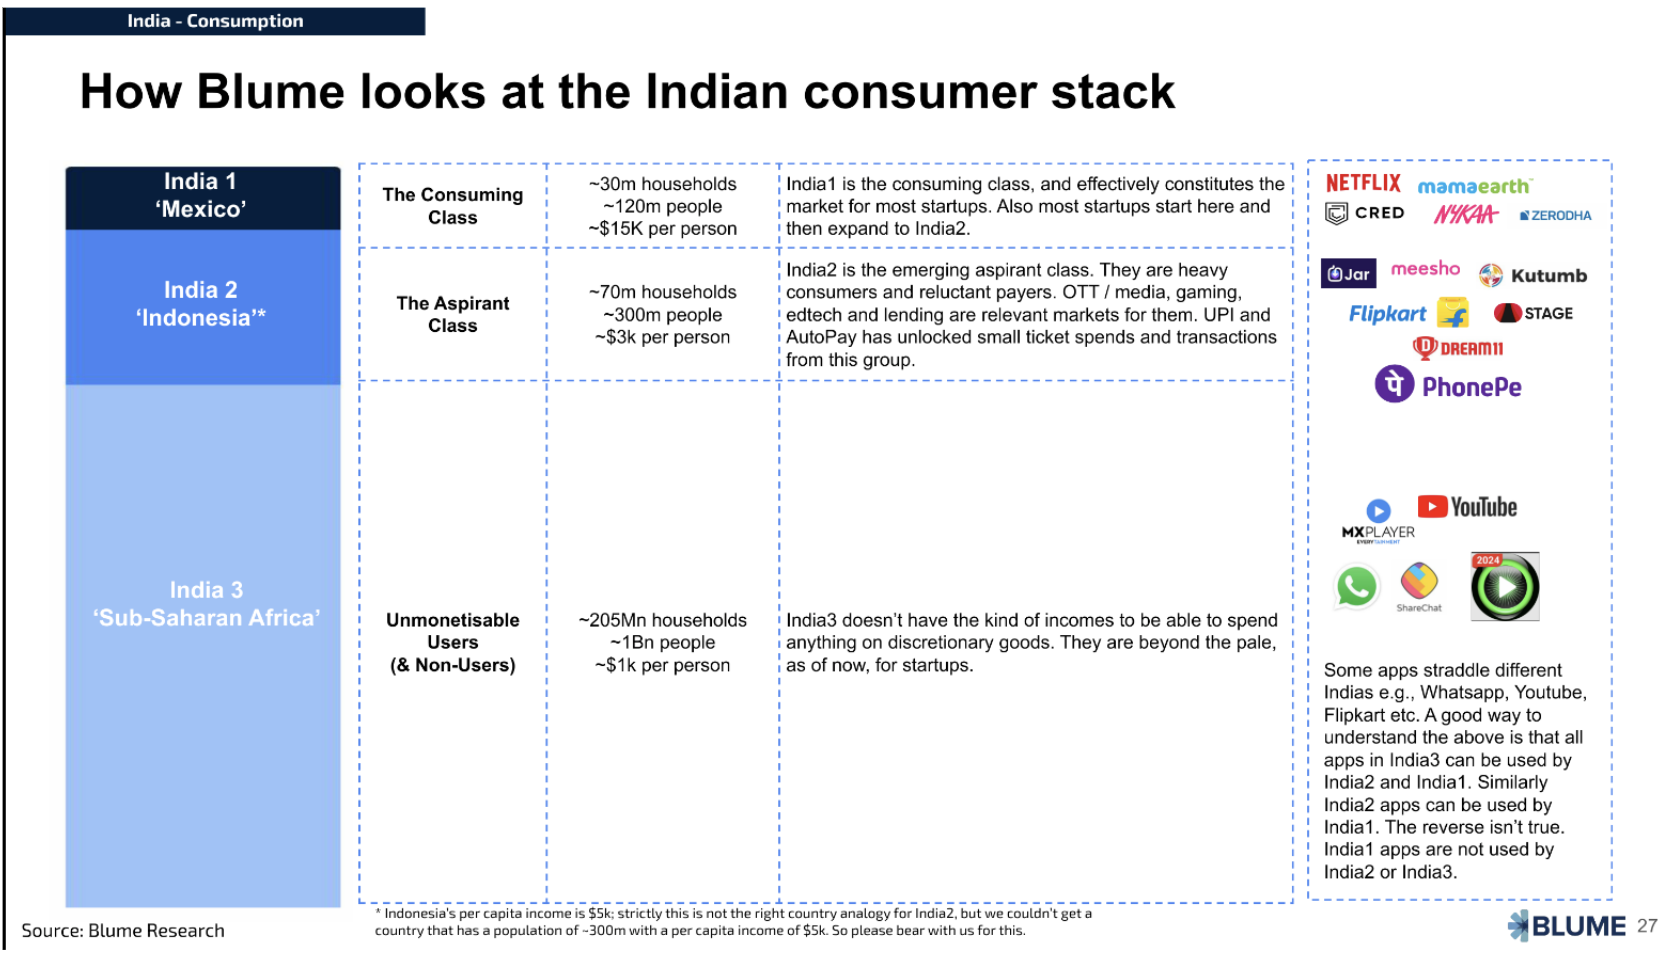
The India123 framework, pioneered by Kishore Biyani and popularised for the startup world by Blume, is a popular framework for understanding Indian consumption. It says that India can be divided into India1, India2, and India3, akin to the three countries that exist in India. This is a powerful mental model for understanding India. India 1 is the engine that drives the economy as the consuming class.
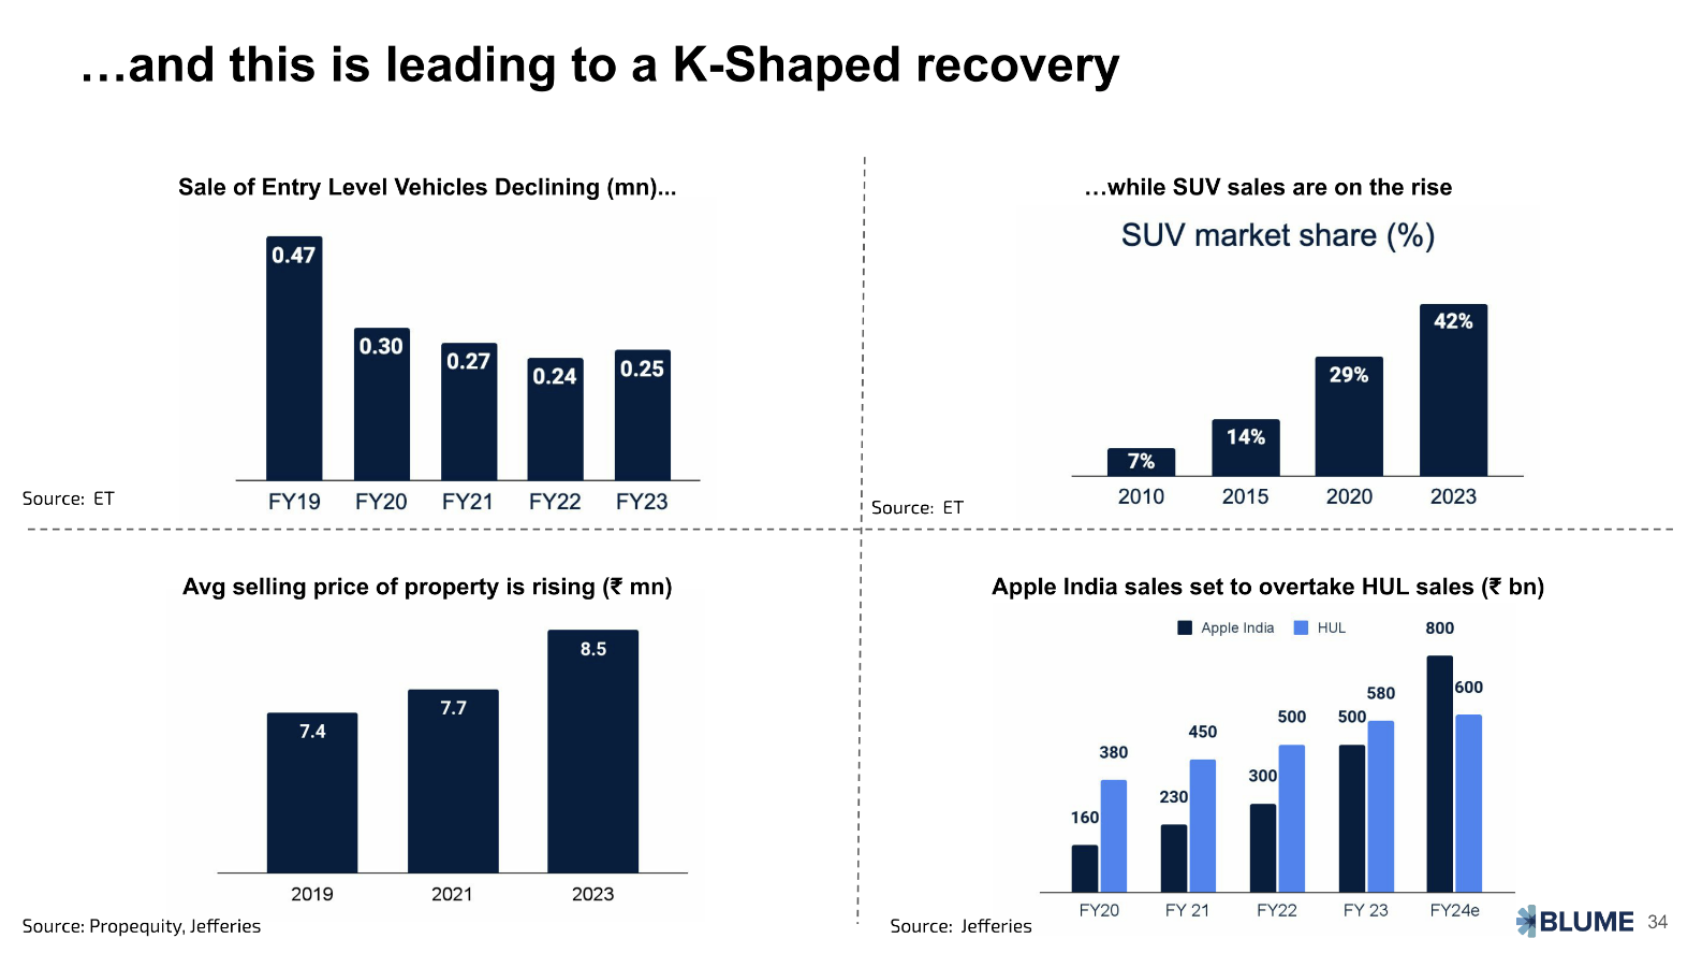
A key trend in India over the past few years has been a K‑shaped recovery, where India1 drives consumption of premium goods, while India2 and India3 have seen more economic distress and are reducing spending on mid-priced goods / entry-level products. Hence this trend where SUV sales are growing but entry-level car sales are declining.
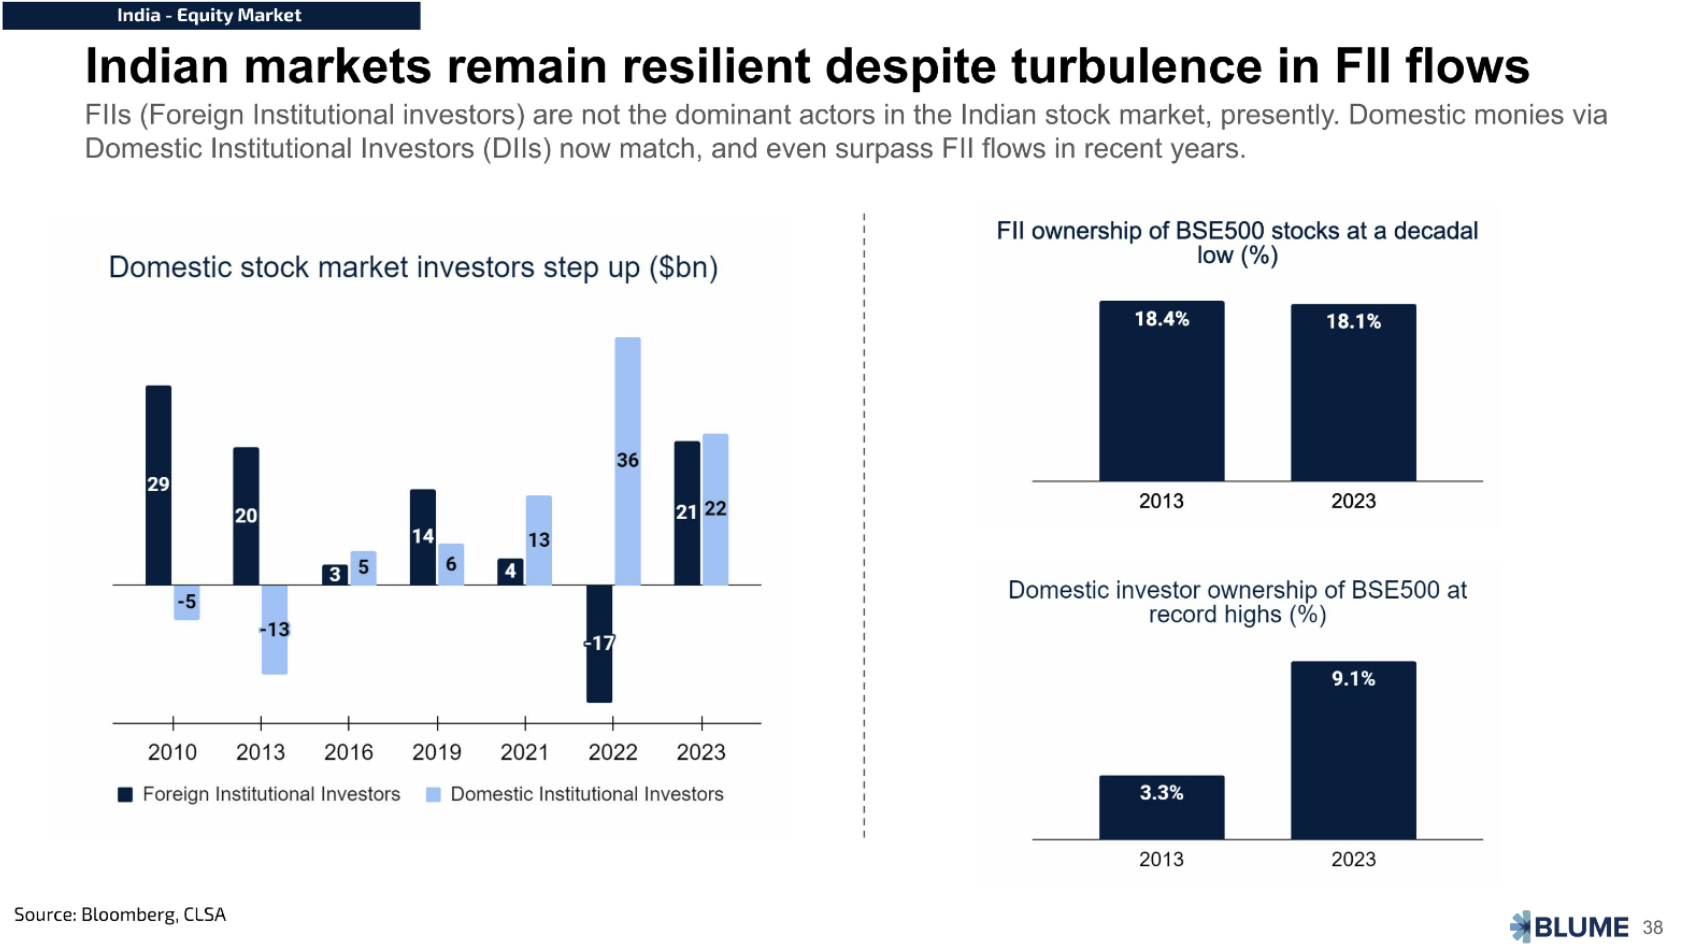
India1’s excess savings are getting funnelled into the financial markets, resulting in record levels of money going into SIPs or Systematic Investment Products. Every month, around two billion dollars is being invested into SIPs. Domestic ownership of the stock market is at a record high. It also means the Indian stock market is seeing record (over)valuations.
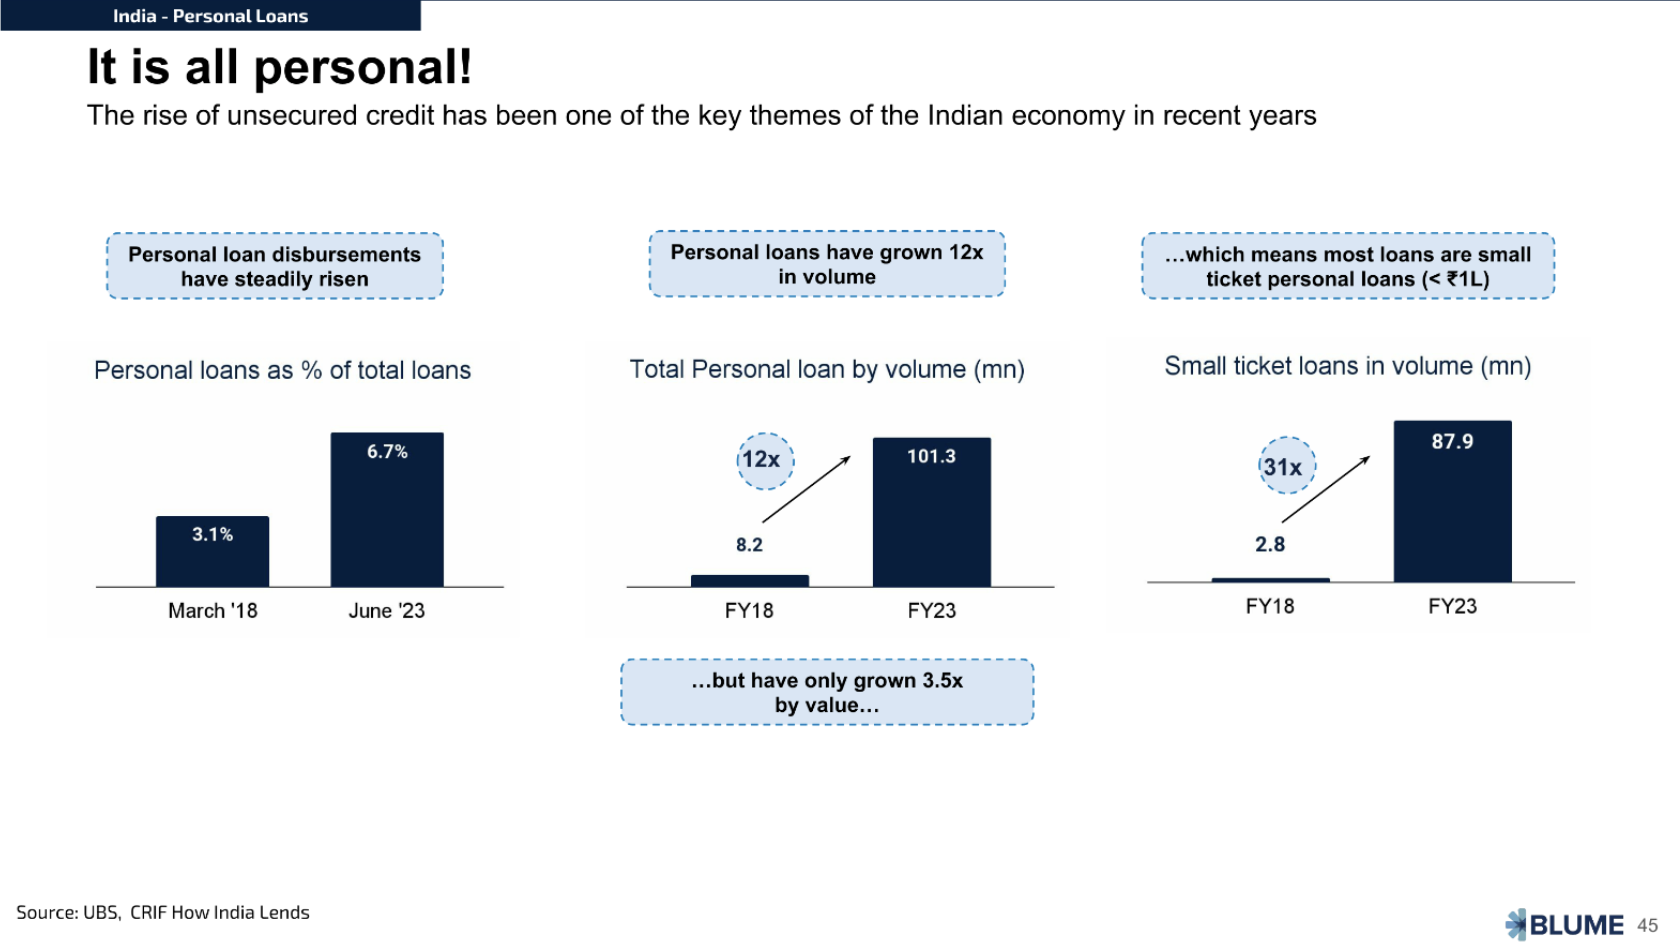
The rise of personal loans has been another key theme in the Indian economy over the past decade. We take a look at this space and ask what is driving the rise of small-ticket loans (31x growth in volumes in the last five years). We explain why RBI is worried about this trend.
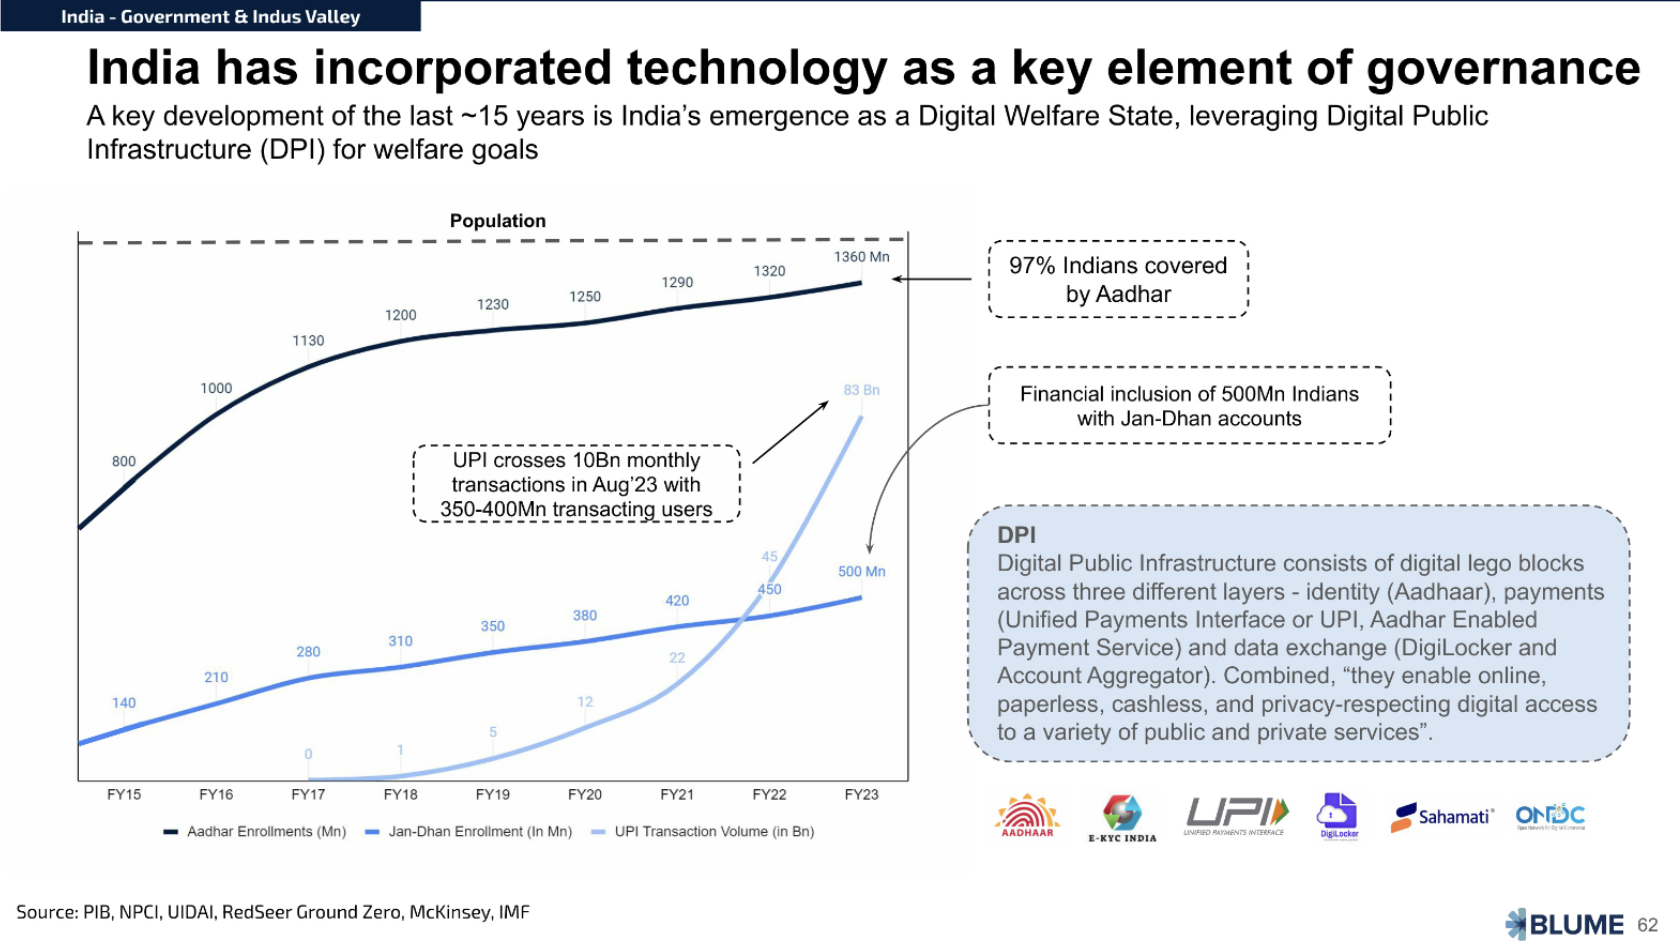
We cover how Digital Public Infrastructure (DPI) has emerged as a distinct and important element of the Indian economy. We dive deep into how new DPI initiatives such as ONDC, Account Aggregator, and UPI autopay, are seeing fast adoption through several case studies.
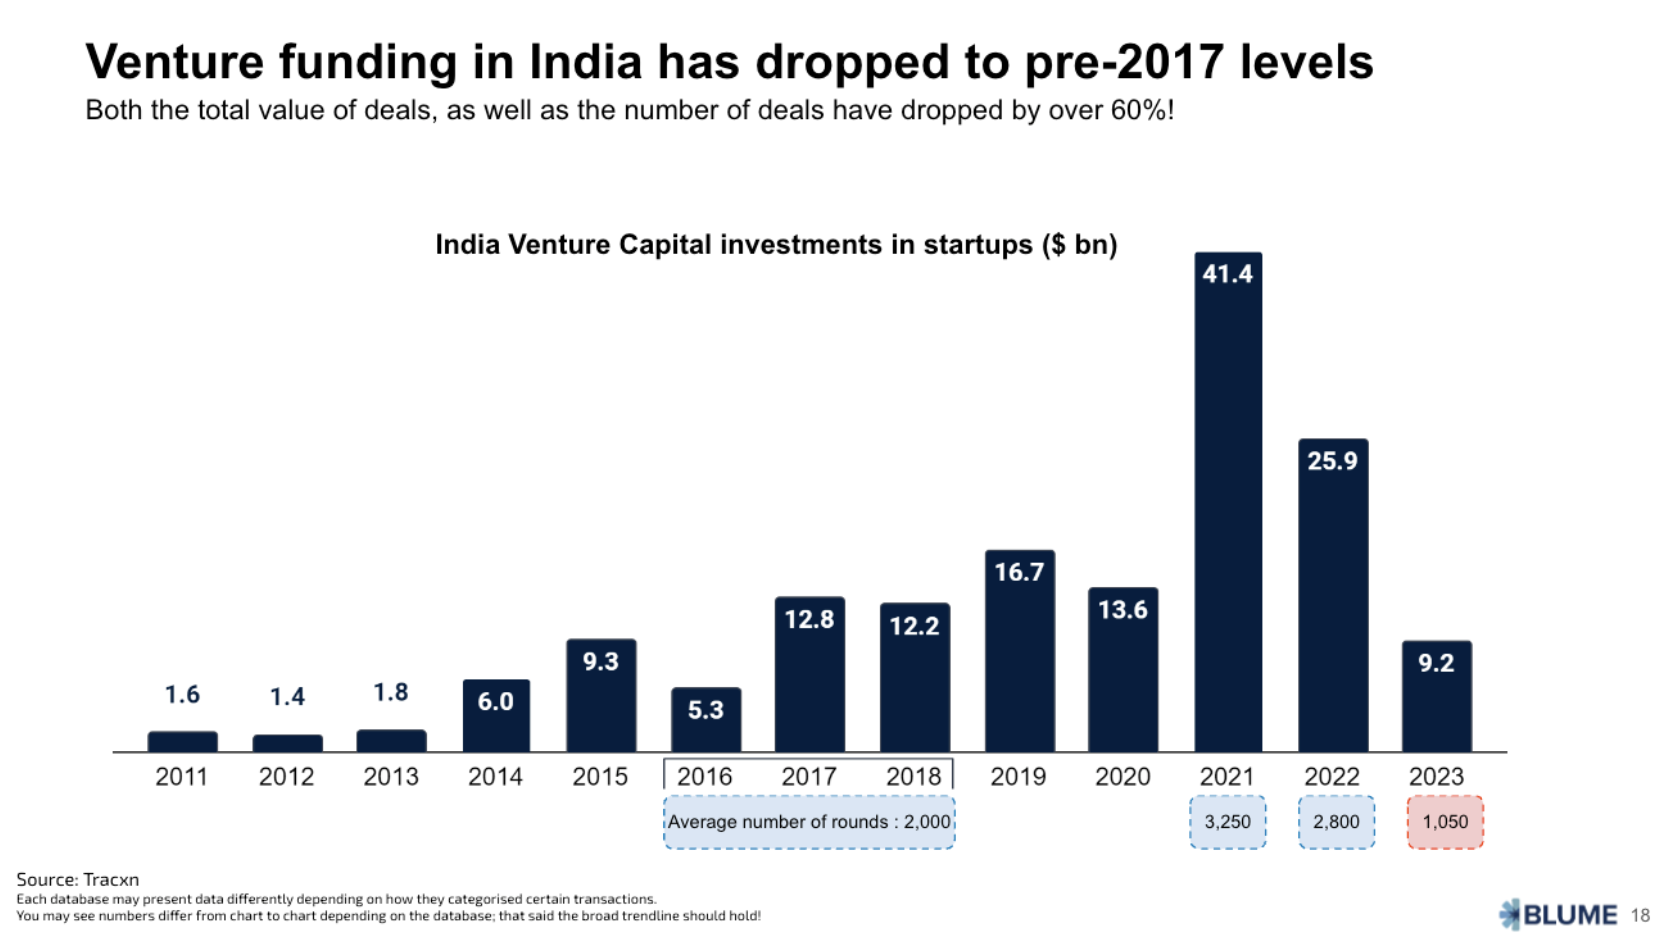
We have seen a sharp drop in funding over the last couple of years; in effect, we are back to the 2017 level of funding. We have also seen a 60% drop in the number of deals being funded.
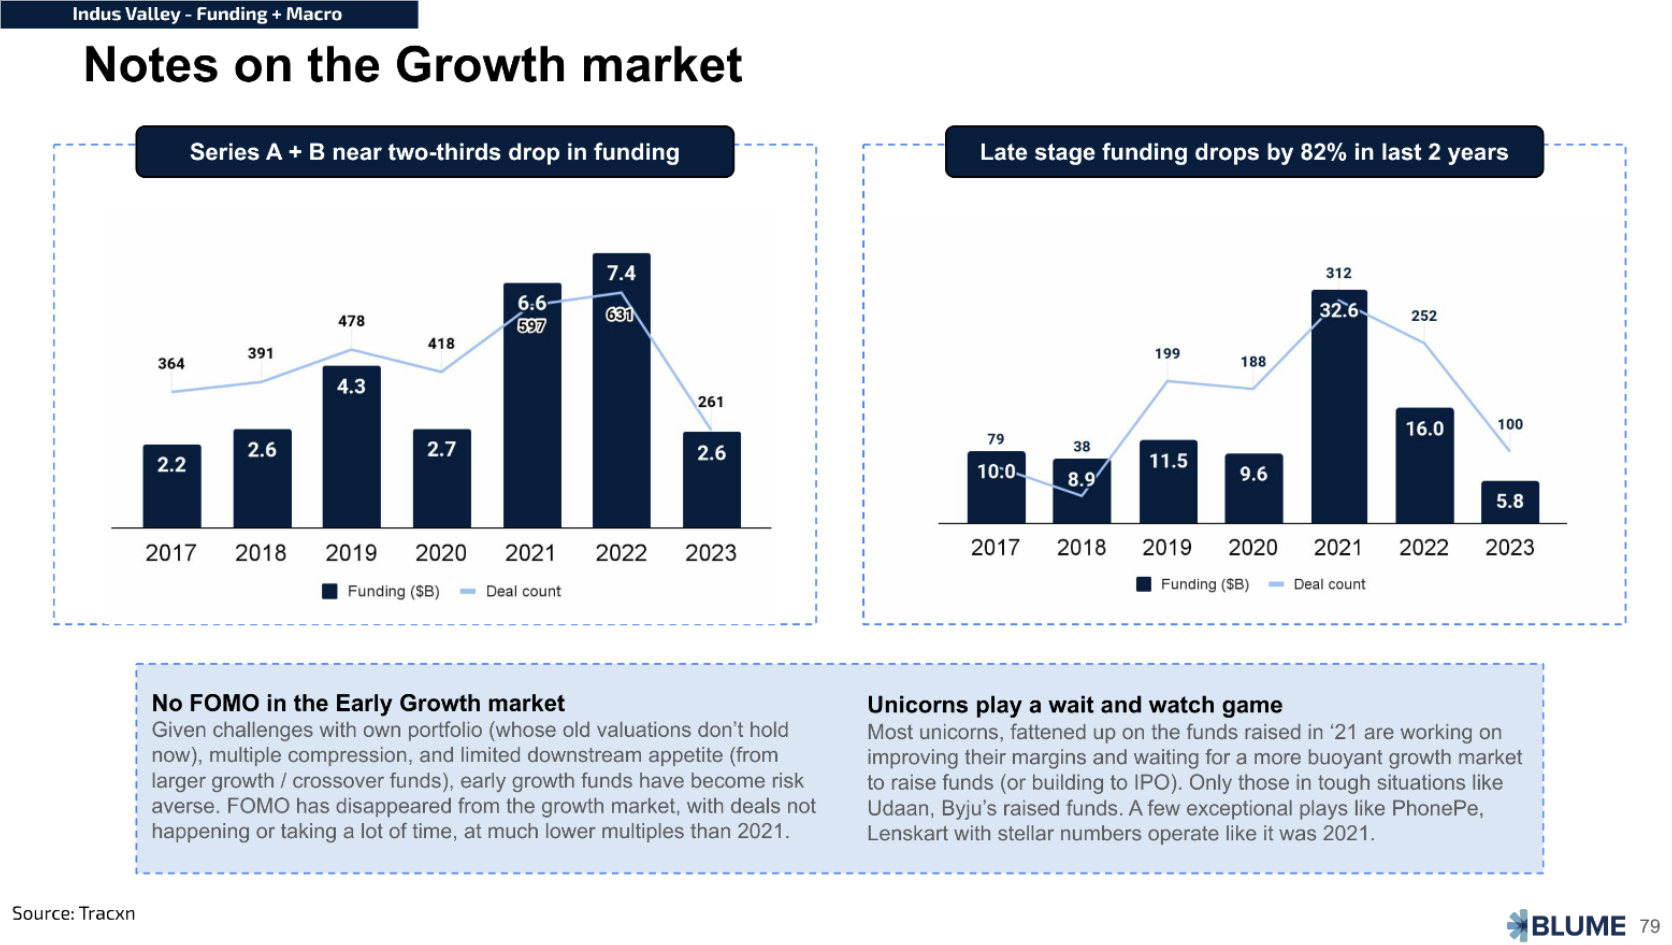
The drop in funding is chiefly driven by a drop in late-stage funding. It is a quarter of what it was two years back. This points to two trends: growth investors staying on the fence, looking for signs of stability and improved unit economics before they step in, and founders who have the luxury of capital in their bank accounts, waiting it out, not wanting to do a down or flat round.
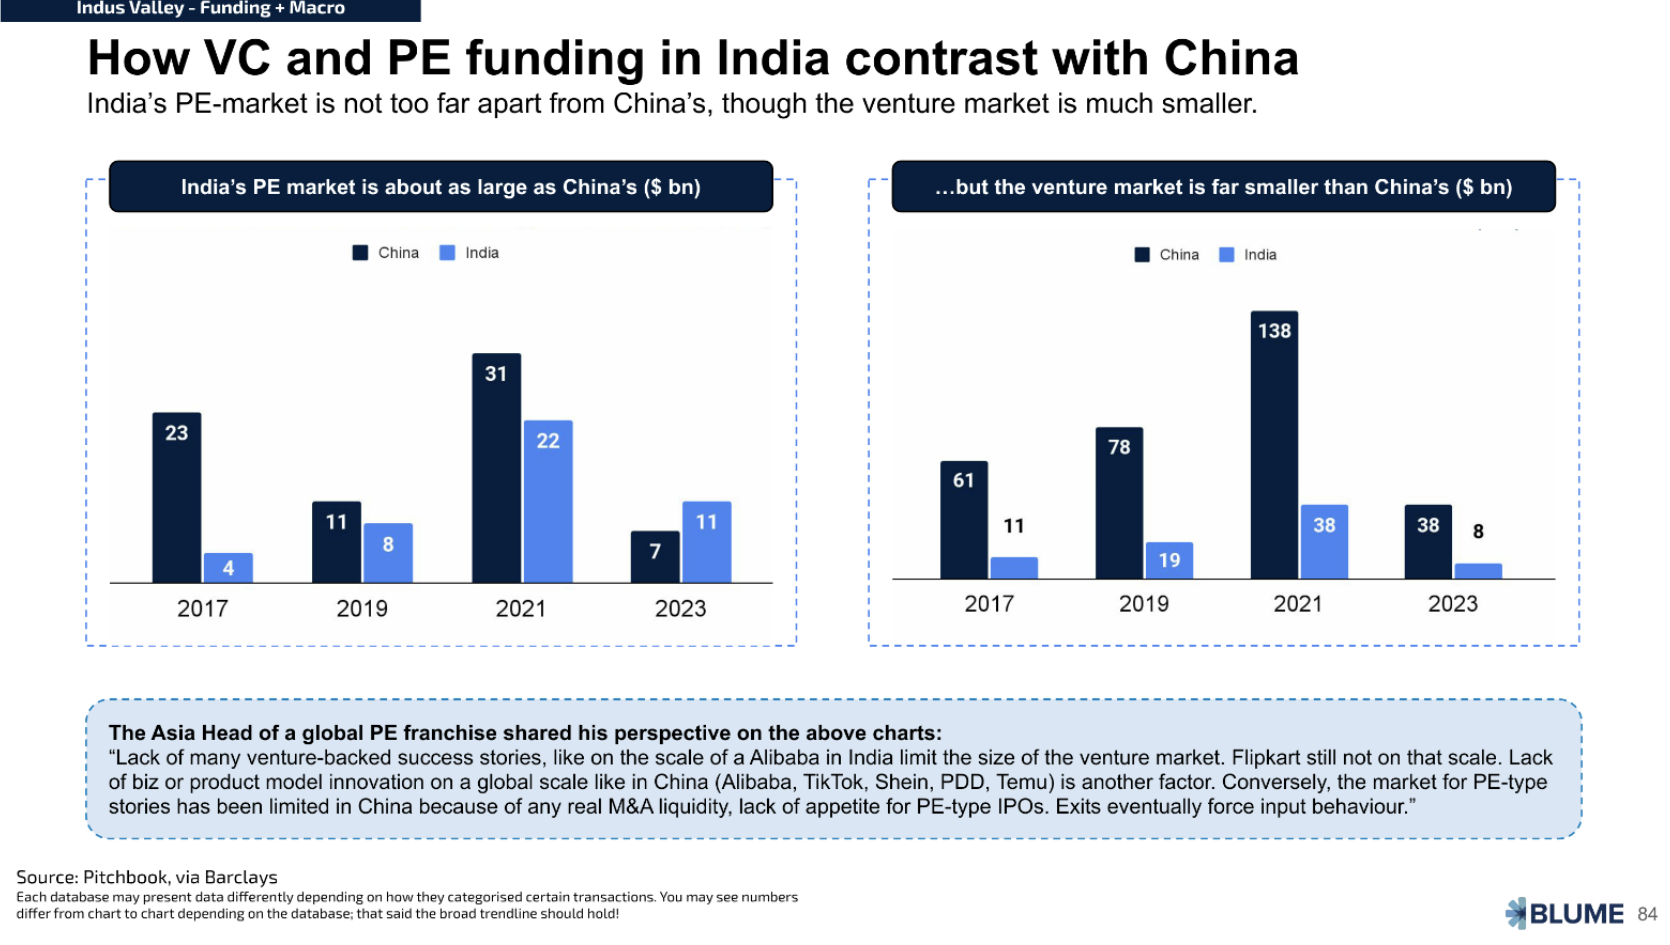
How does VC and PE funding in India contrast with China? While making this report, one significant learning has been how different China vs Indian private markets have been, including how Indian PE markets punch above their weight compared to China, and how it is a function of delivered exits and public investor appetite.
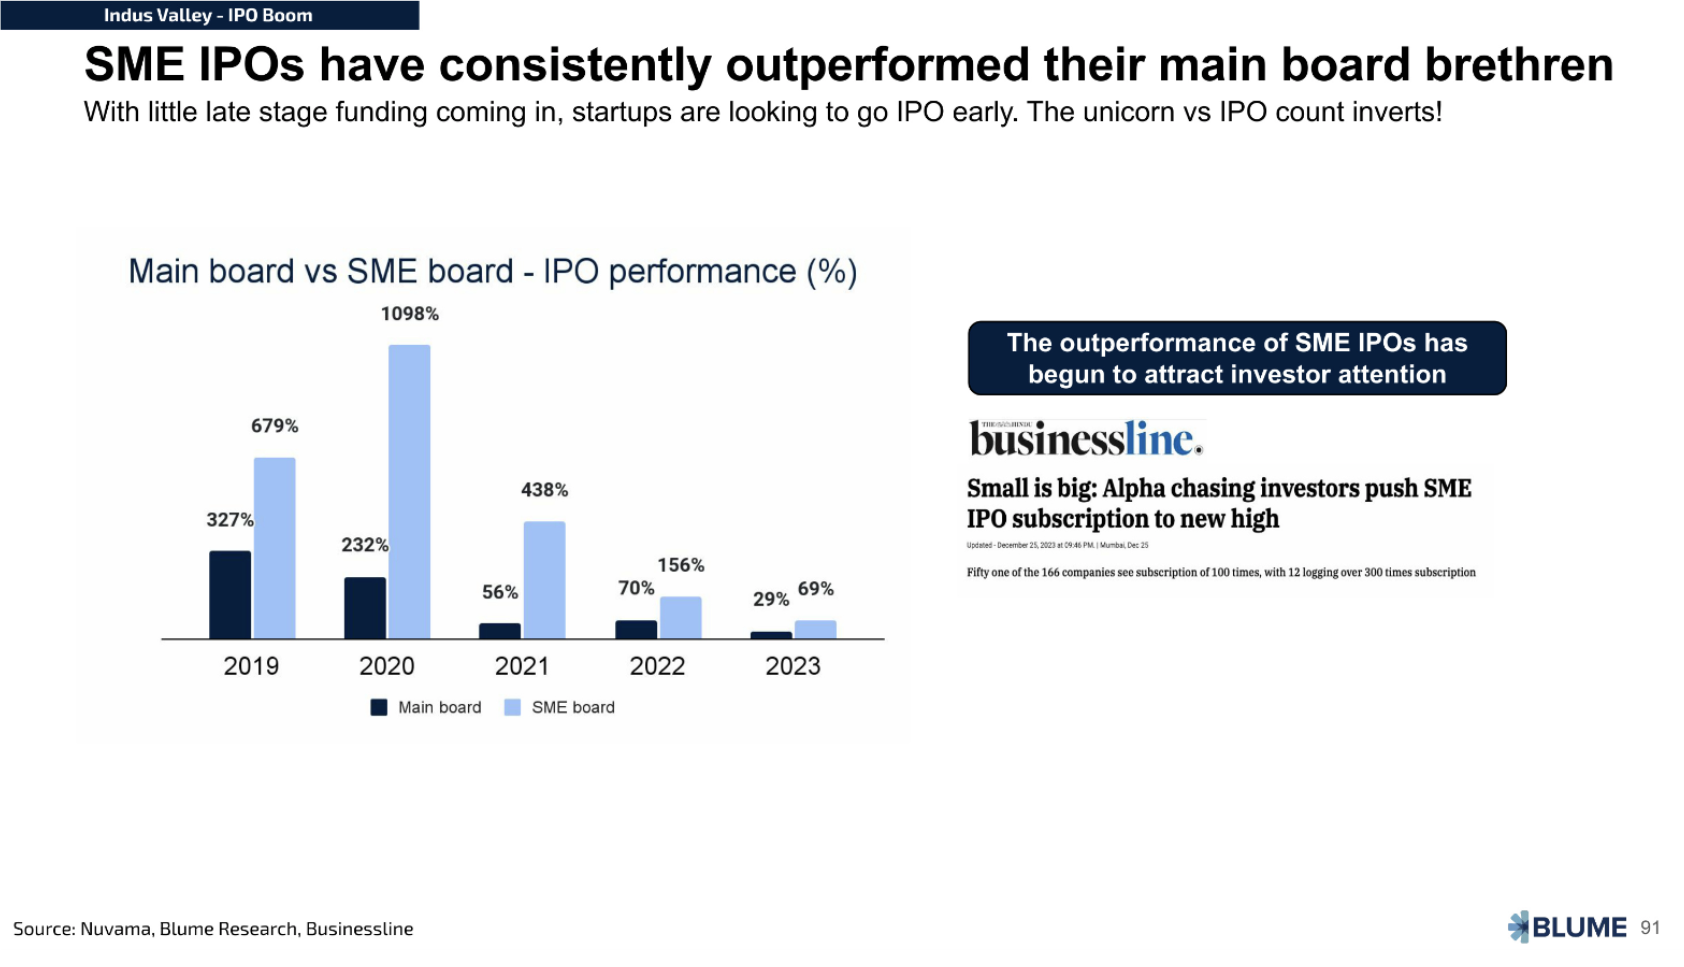
SME IPOs are on the rise and becoming a credible way for smaller companies to IPO. It is worth noting that SME IPOs have continuously outperformed the main board over the last few years.
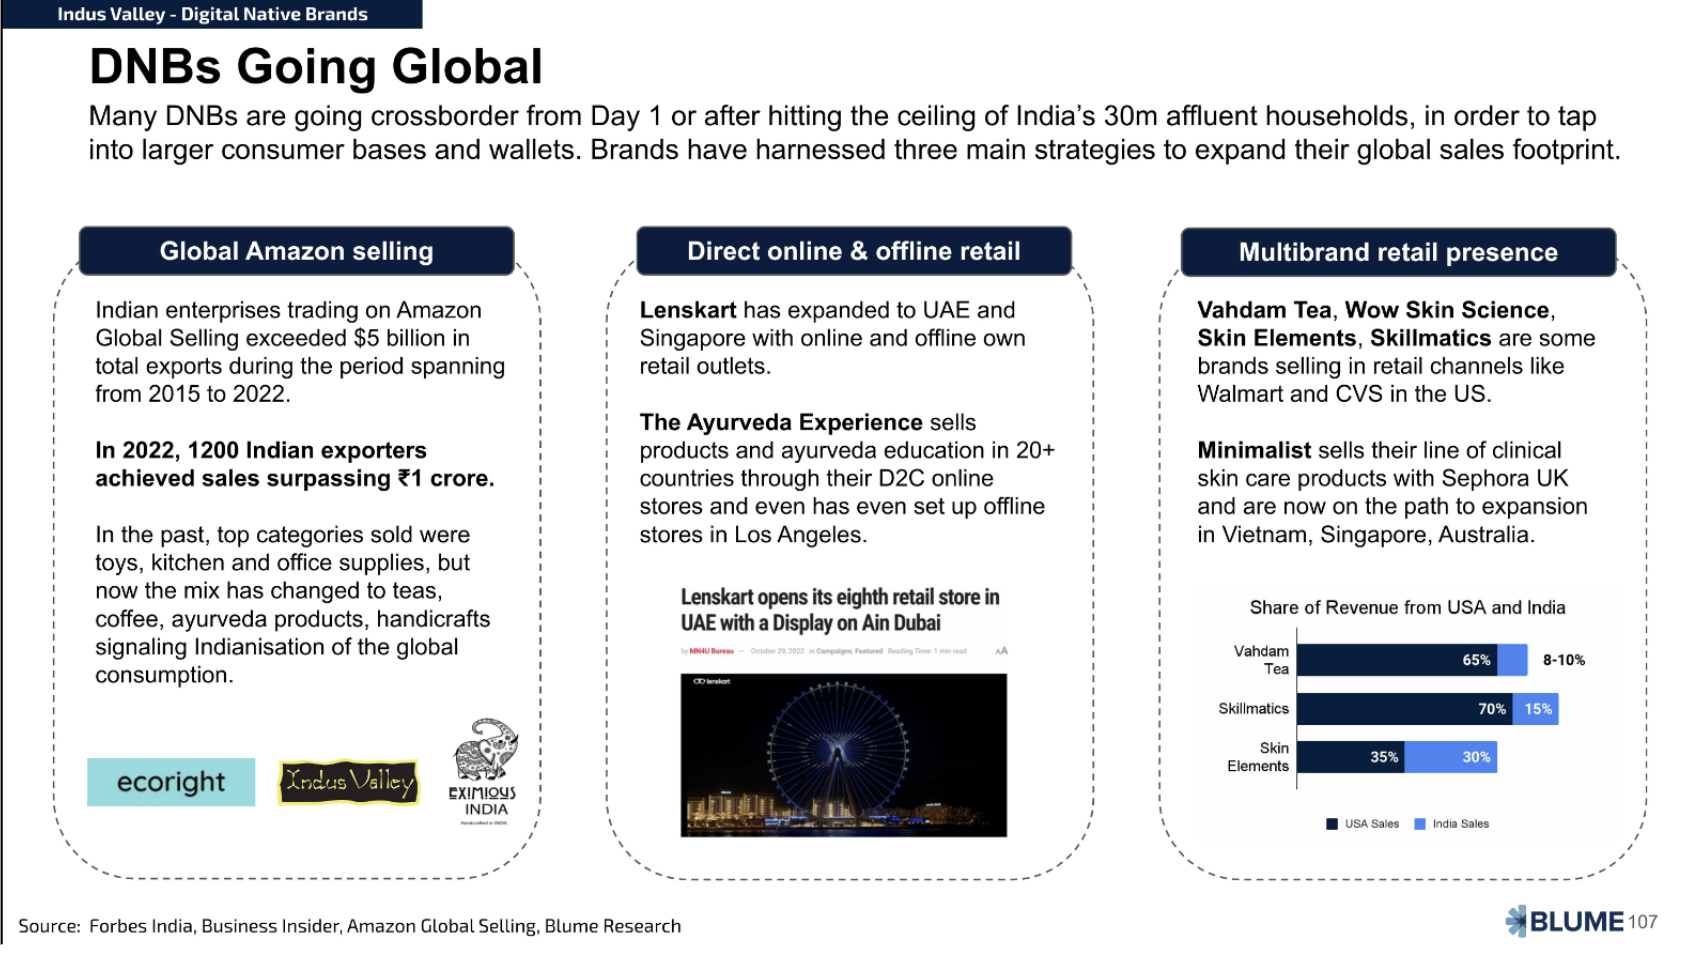
A key theme in the Indian startup ecosystem lately has been the rise of Digital Native Brands. These brands have been growing steadily over the last few years and are beginning to create their distinct playbooks for international and domestic expansion.
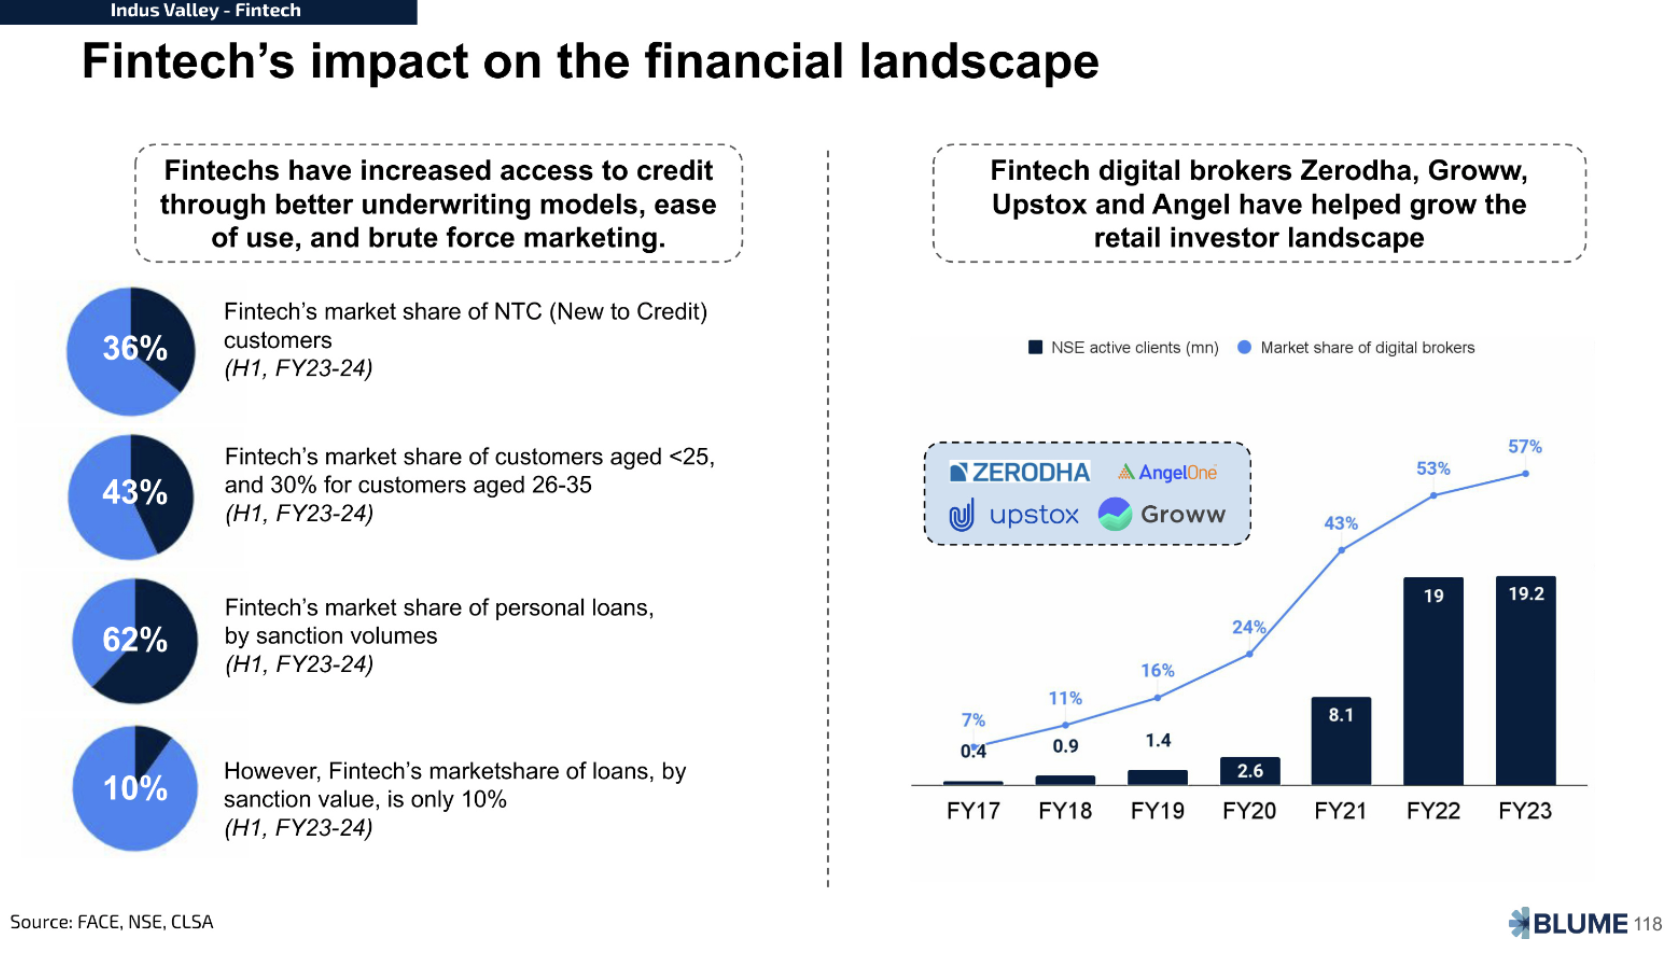
Fintech has leveraged UPI and other Digital Public Infra tools to grow rapidly, right from having a majority market share in retail broking to leading access to credit for underserved customers in India.
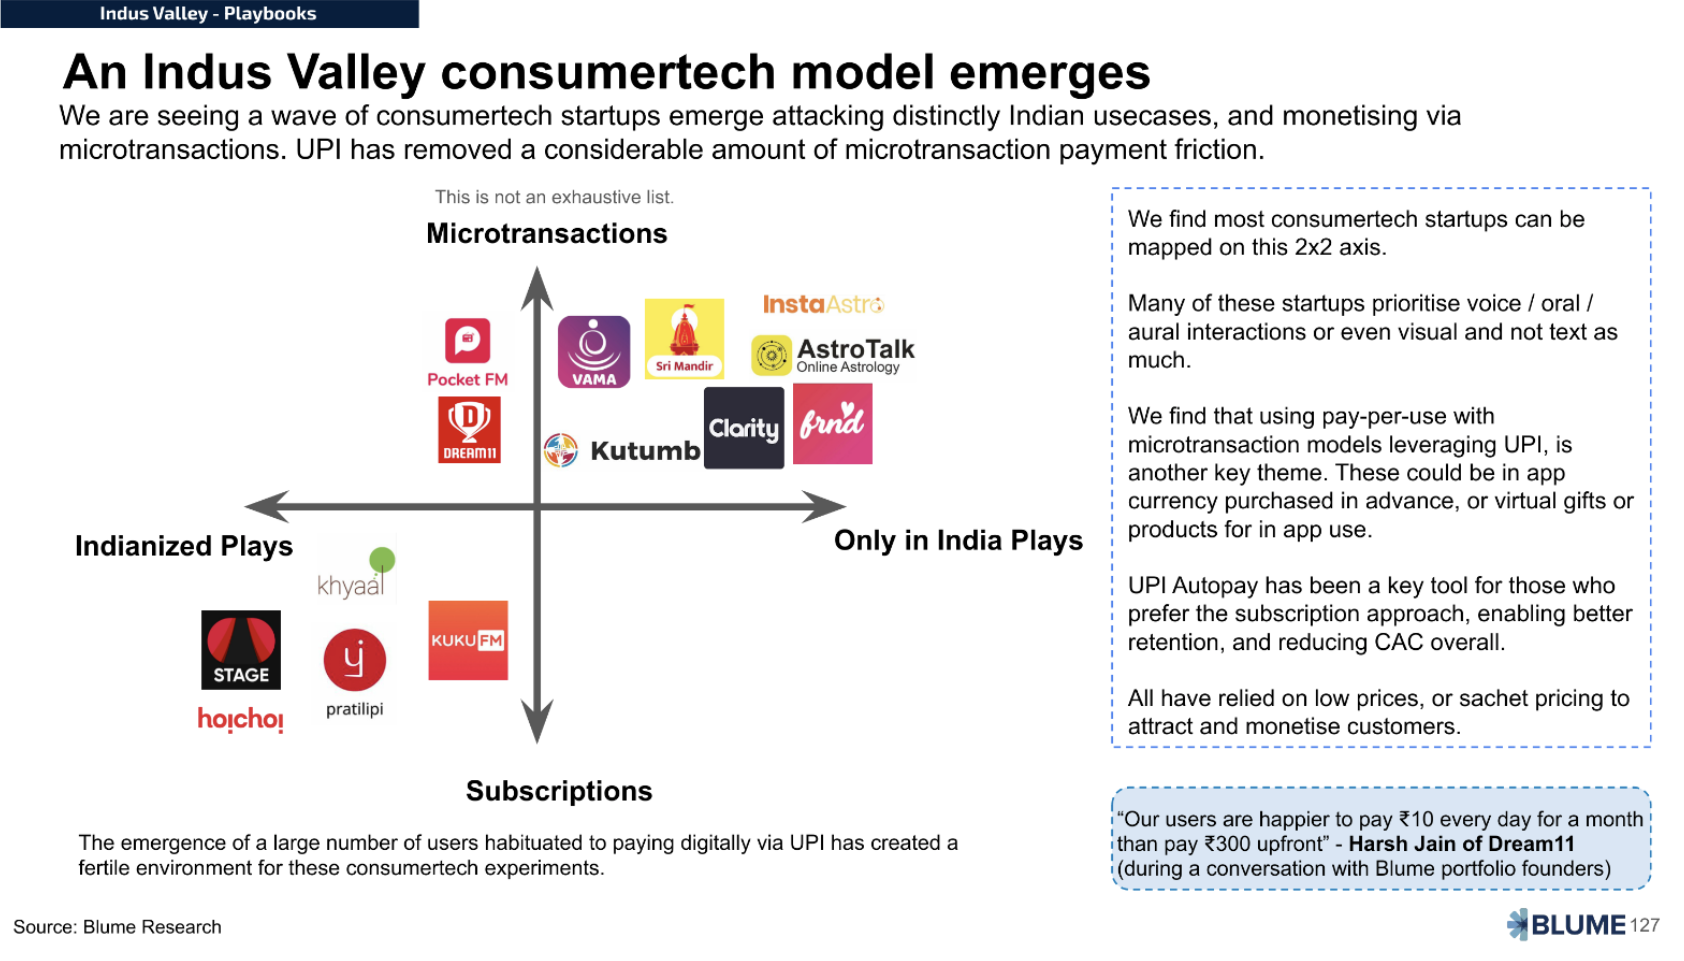
Indian startups are also creating a distinct monetisation playbook by enabling microtransactions, or subscriptions built on top of UPI Autopay, when very few believed that Indian customers would pay or held that the only way to monetise was via ads.
Those were just a few of the slides. We hope this has whetted your appetite for more. Please check out the Indus Valley Annual Report 2024 at the link below.
The Indus Valley Annual Report 2024.
Please feel free to reach out to the authors at their respective email IDs to share your feedback and questions, if any.
Sajith Pai — email hidden; JavaScript is required
Anurag Pagaria — email hidden; JavaScript is required
Nachammai Savithiri — email hidden; JavaScript is required
Authors


Sajith Pai
I am greedy to be part of ambitious founder journeys, and help inflect them to greatness. The founders who select me to be part of their journeys, pick me to be their PMF coach, social media cheerleader, sparring partner, 11 pm friend,…- Current Section
- Partner
- Sector
- EdTech, HRTech, ConsumerTech, B2B Commerce & Marketplaces

Anurag Pagaria
Anurag looks at all things B2B at Blume. He has spent over 4 years working in startups, donning various hats from program to product and everything in between.Anurag shares a deep love and admiration for startups and the…- Current Section
- Associate
- Sector
- B2B & Vertical Saas

Nachammai Savithiri
Nachammai supports the Consumer investments practice at Blume. She is a graduate from IE University, Madrid, holding a Master's Degree in Digital Business & Innovation.Nachammai comes from the other side of the table,…- Current Section
- Analyst
- Sector
- ConsumerTech, Commerce & Consumer Brands, HRTech, EdTech, Media, Entertainment & Gaming
Commentaries

Cracking the Code: Emerging Monetization Strategies for Digital Businesses in India 2
For those of us who are in the business of observing the Indian consumer, Blume’s Indus Valley Report is the perfect starting point. The report splits the Indian consumer into three distinct sets - India 1, 2, and 3. The India 1…- Current Section
- Commentary
- Authors
- Mithun Madhusudan
- Published