
In case you landed on this page, looking for Indus Valley Annual Report 2024, we have got you covered. Download the 2024 edition here.
We are delighted to announce the 2023 edition of the Indus Valley Report, taking a deeper look at the Indian startup and venture ecosystem through 100+ insightful and some provocative charts, identifying key themes, patterns and trends in Indus Valley (our moniker for the Indian startup ecosystem, or the Indian Silicon Valley).
In 2022, we launched the first edition of the Indus Valley Annual Report, which focuses on India’s startup ecosystem. The first edition covered the rise and evolution of India as a startup superpower and the rise of the Indus Valley.
In the 2023 edition, we delve deeper into Indus Valley’s soft power and the many nuances of the Indian market, specifically the startup ecosystem.
The report is divided into three sections:
- Interpreting India
- Indus Valley — India’s Soft Power
- State of Indus Valley 2022
Here is a sample of the recent edition, giving you a glimpse into its innards. We hope you will be tempted to dive deeper into the complete report, which you can access here. The 2022 edition of the Indus Valley Annual Report can be found here.
Resources
- Indus Valley Report 2023 Google Drive
- Indus Valley Report 2022 Google Drive
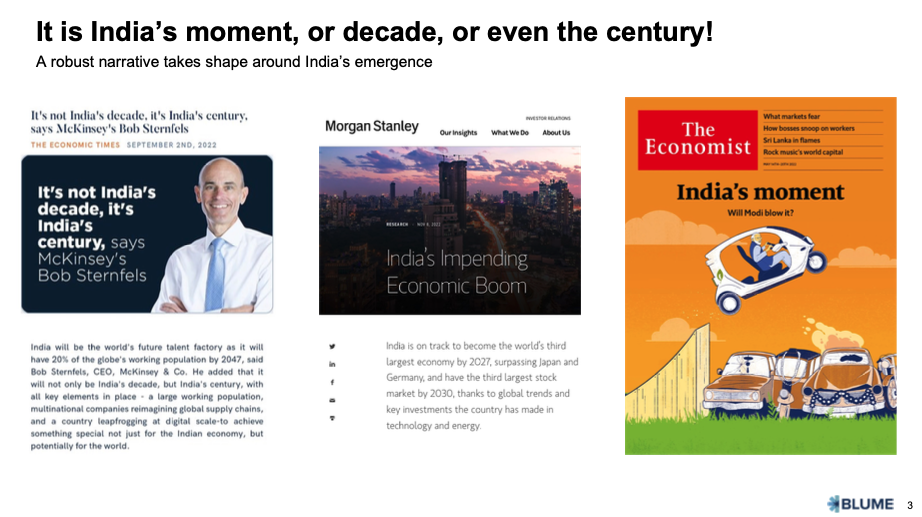
In 2022, India’s emergence as the next economic power became a mainstream sentiment. Global publications like The Wall Street Journal, The New York Times, and The Economist captured this mood in their stories.
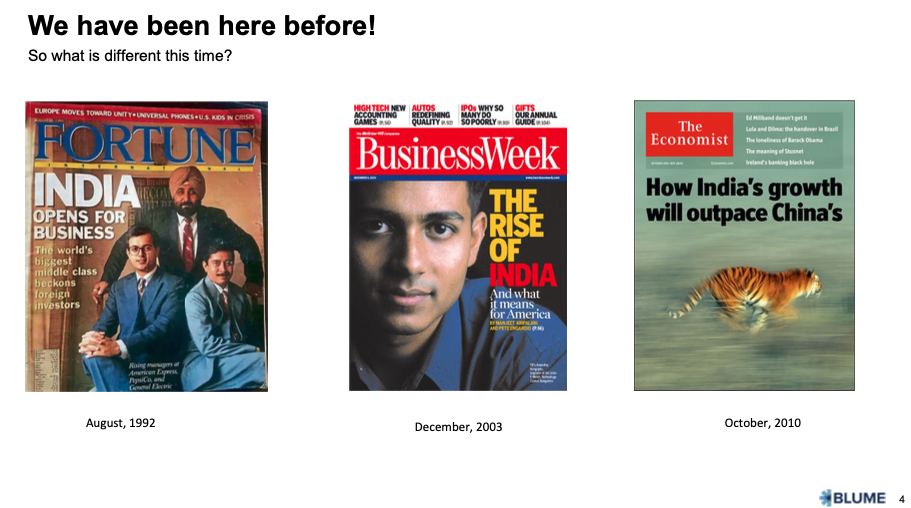
But we have been here before, in fact, many times in the last two decades. So what’s different this time?

We believe a powerful trifecta of forces has aligned, making it different this time compared to before: improving infrastructure, formalization, and a muscular industrial-manufacturing policy.
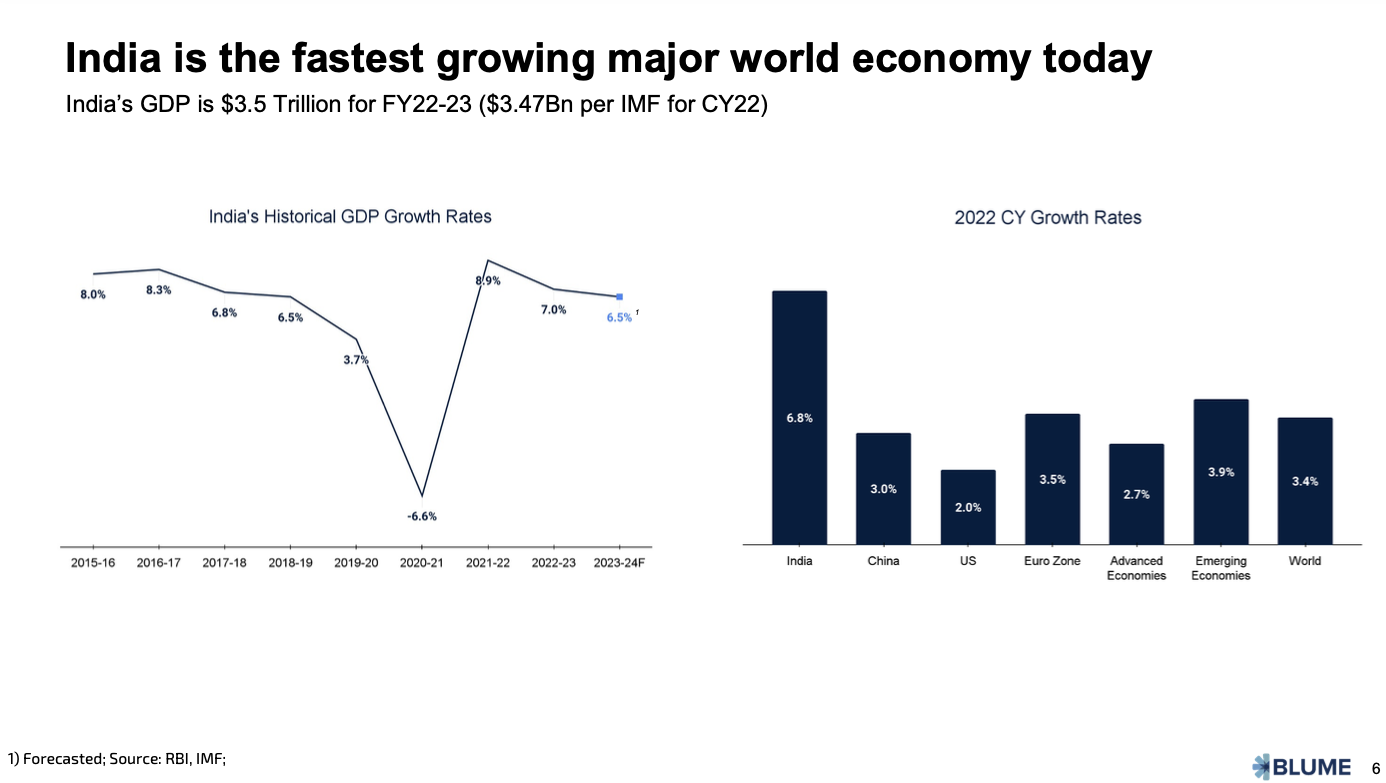
India is today the world’s fastest-growing major economy, and almost all estimates point towards the Indian economy growing between 6% to 7% annually over the next 4 to 5 years.
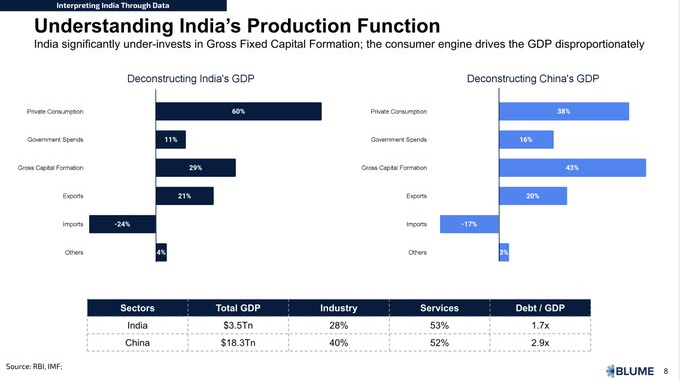
However, India’s growth hasn’t taken off like China. The key reason for that is while India’s private consumption is a larger part of its GDP than China’s, its Gross Capital Formation is only at 29% compared to China’s 43%.
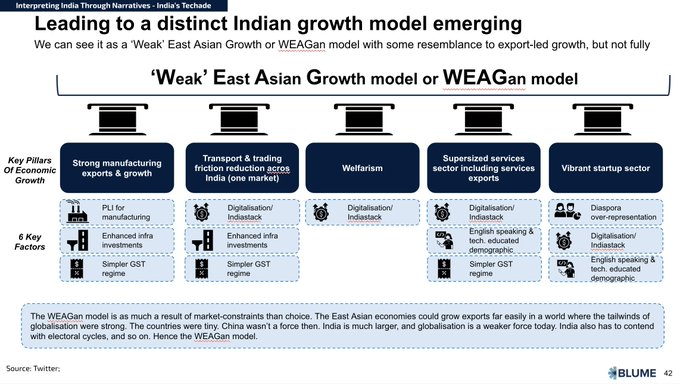
The aforementioned trifecta of forces, a growing consumer engine, better infrastructure, and improved basic services have compounded into a distinct growth model for India, which we characterize as the WEAGan model (Weak East Asian Growth model), as against the aggressive ‘carnivorous’ growth in China and parts of SEA.
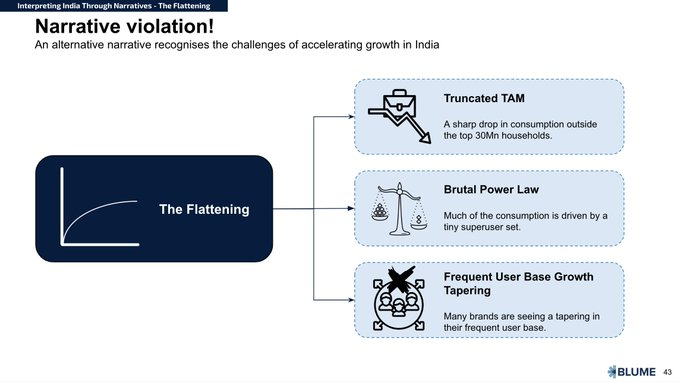
However, there is another narrative that we can consider when it comes to accelerating growth in India: “The Flattening”. This alternative perspective acknowledges the difficulties that come with unbridled development, and the potential consequences that this progress might bring.
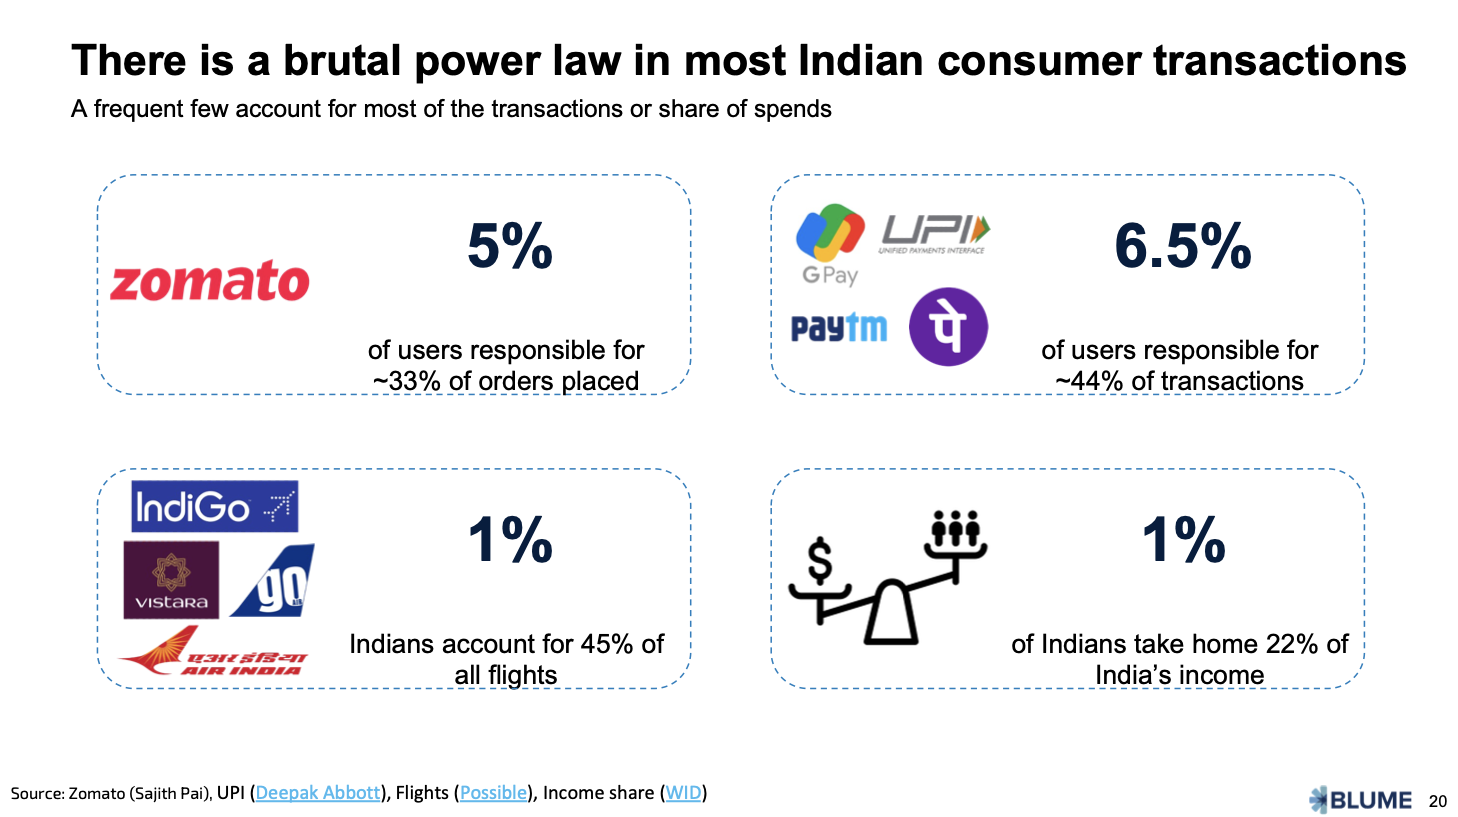
There is also a brutal power law operating in India. A small minority of high-paying users account for a third to half of all spends and transactions.
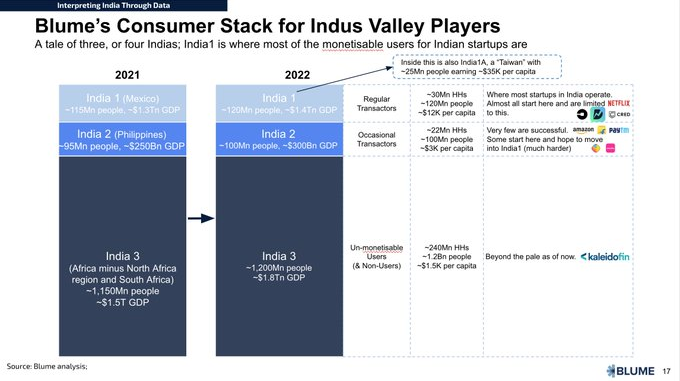
Our analysis of the consumer classes in India also brings us to the consumer stack we use in Blume to understand India and the potential most consumer brands have. While India 1, 2, 3 have all grown in size, India 1 (10% or so of India) has become richer on a per capita basis.
Section 2 — Indus Valley — India’s Soft Power
Section 2 of the Indus Valley Annual Report focuses on how Indus Valley is India’s soft power, specifically in terms of tech adoption. The section covers three perspectives: Money Muscle, Impact, and Influence. From a monetary standpoint, India’s venture market is disproportionately sized compared to other “macro” sizings. Indus Valley’s impact has been seen across many spheres, including bringing “new to credit” customers into the mix. As a result of the impact created, Indus Valley is also making its influence felt by the masses.
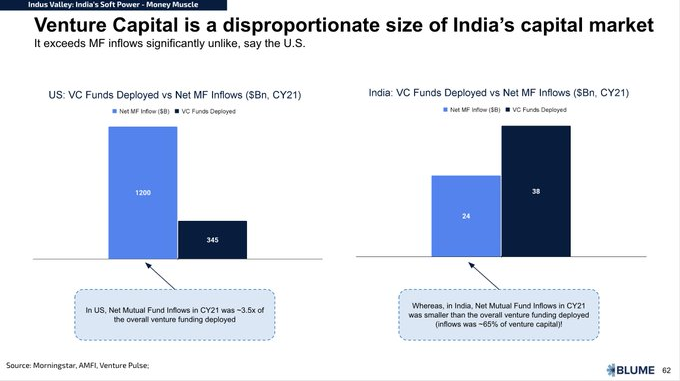
From a monetary standpoint, India’s venture market is disproportionately sized when compared to various other “macro” sizings.
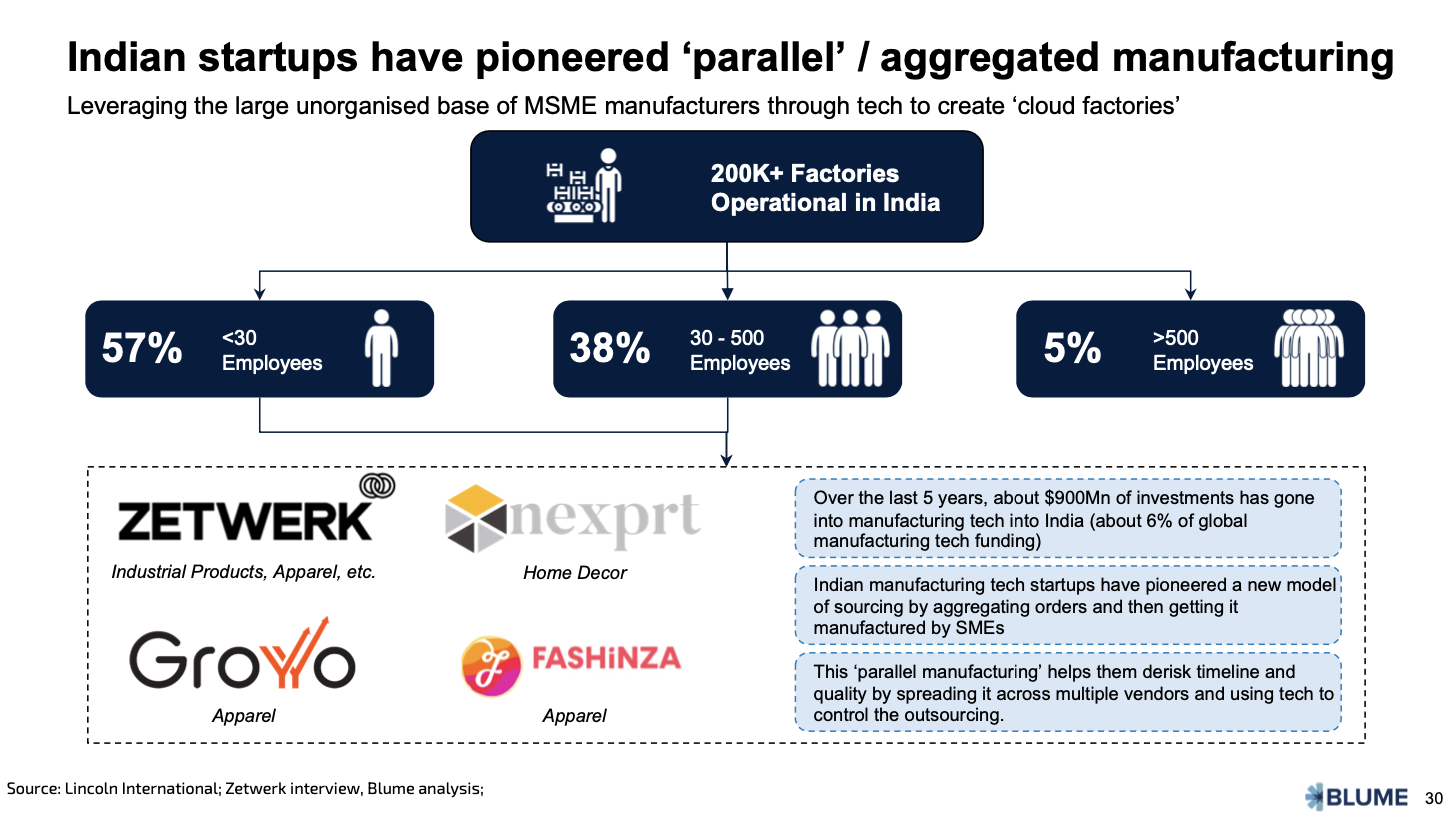
Indian startups are no longer copying the West, as was seen in the first wave. They are pioneering uniquely Indian innovations like cloud factories — leveraging the large MSME base of factories and manufacturers by sourcing orders and splitting them across the MSME base, think of it as parallel manufacturing or Cloud Factories.
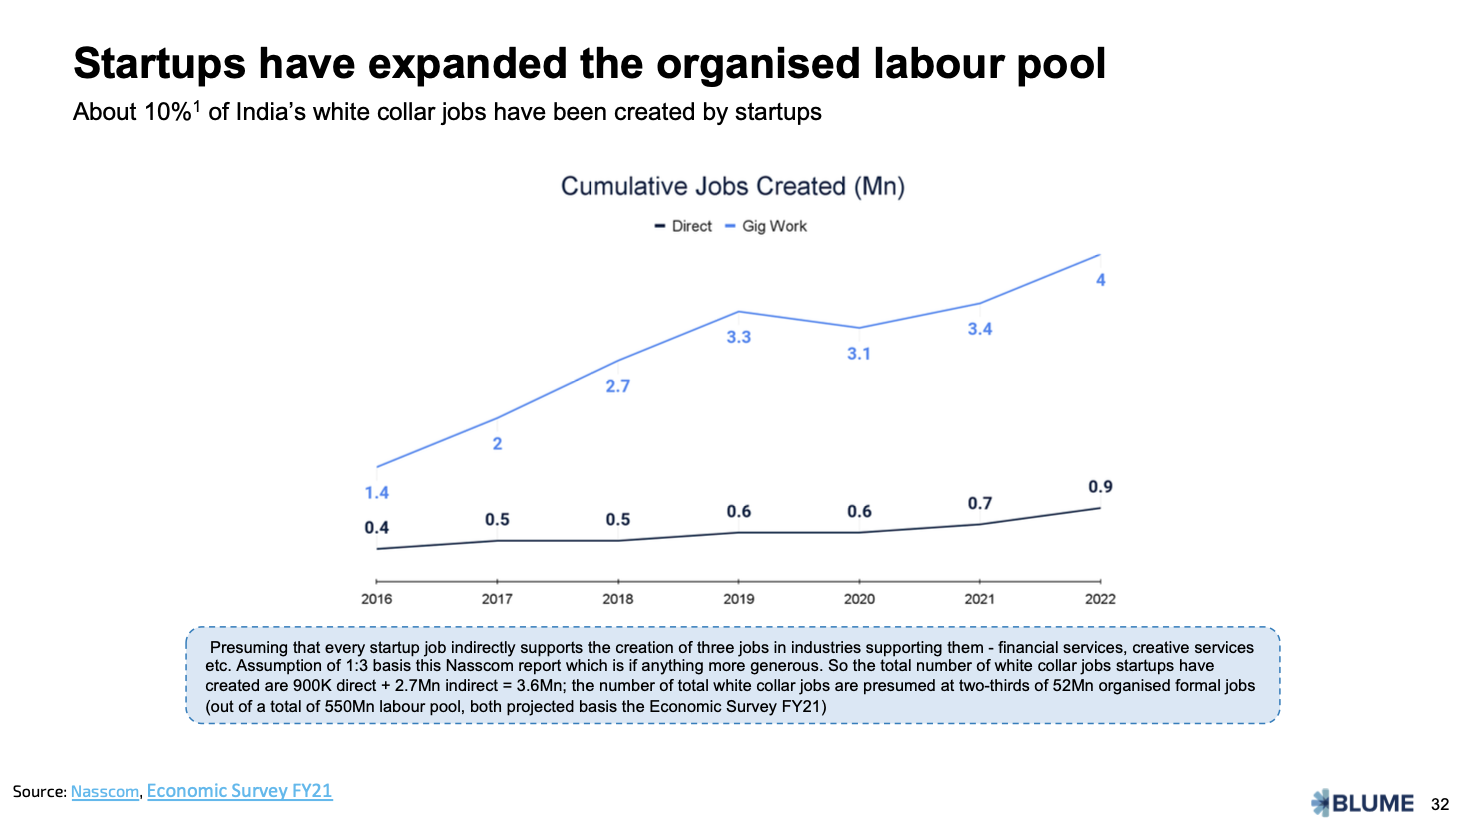
This innovation is leading to downstream impact. For instance, Indus Valley accounts for about 10% of the white caller class, and about 4M gig workers. It is expanding the lower middle class and expanding the size of India2.
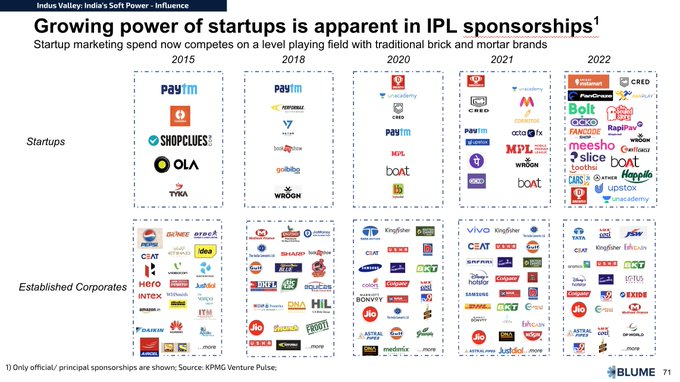
Indus Valley’s impact is being felt by the masses, as illustrated in this slide showcasing the evolution of sponsors in the Indian Premier League (IPL), the Indian equivalent of the Super Bowl.
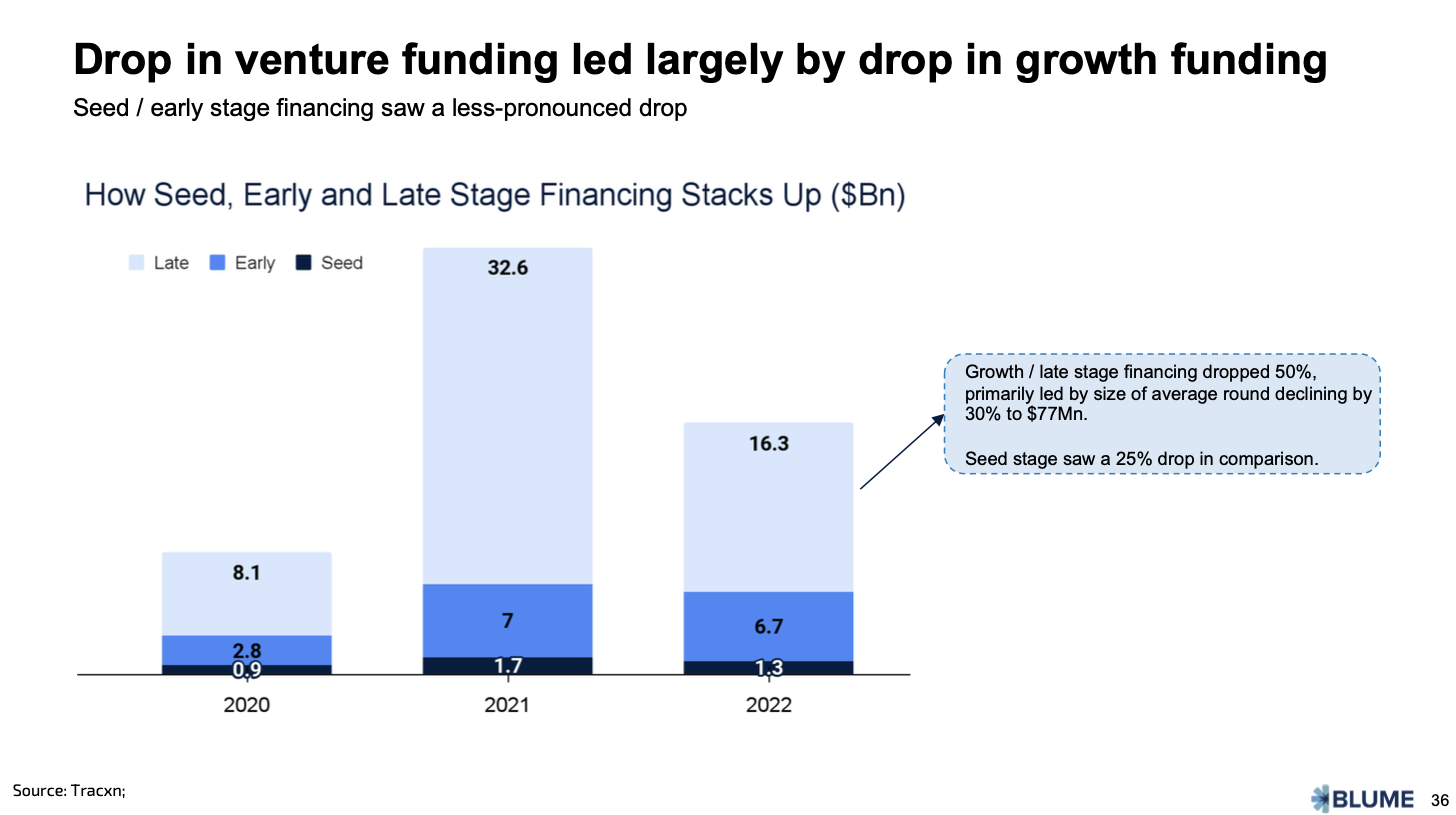
Much of the drop in the VC investments in India in 2022 came from the drop in late-stage or growth investing that dropped ~50%. Seed investing saw a 20% drop, but the average seed round increased by about 30%.
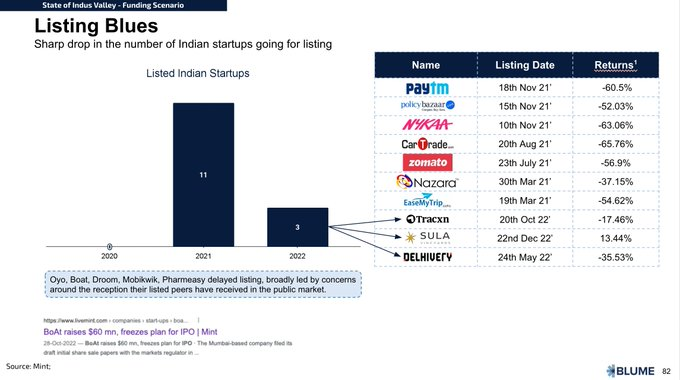
Just like the growth funding market, the startup ecosystem had a tough time with the public markets also. Even Public market thought leaders feel late-stage investors are juicing out all the value before listing. As a result, multiple startups delayed their listing.

Startups need to reconsider their IPO strategy and study companies that have used public markets to grow. If we don’t have startups going public earlier in India and the tech IPO market doesn’t grow quickly, we may end up with an unreliable market for tech startups.

Growth funding in India, relative to tech public financing, is much larger compared to China. In fact, in 2021, growth funding was twice the entire Indian IPO market and not just tech IPOs. If we do not have startups listing earlier in India and a tech IPO market doesn’t grow fast, there’s a risk of creating a poor public market product for tech startups.
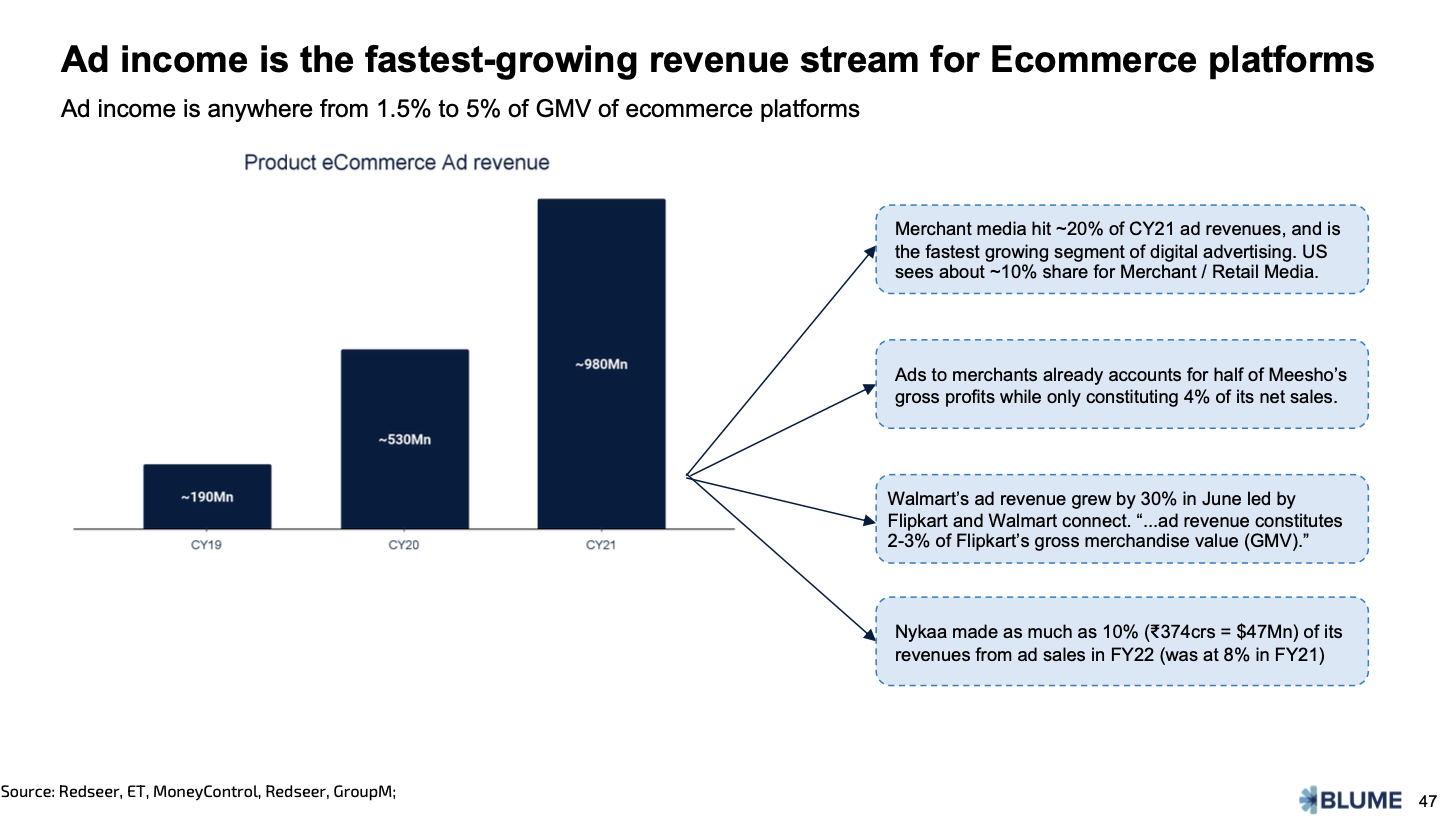
E‑commerce companies now make ~20% of their revenue from digital ads, with the ad income now becoming 1.5% to 5% of GMV. Nykaa, one of India’s largest beauty and fashion e‑commerce companies, made about $50M or ~10% of its revenue from digital ads, and Meesho is betting their entire farm on this.
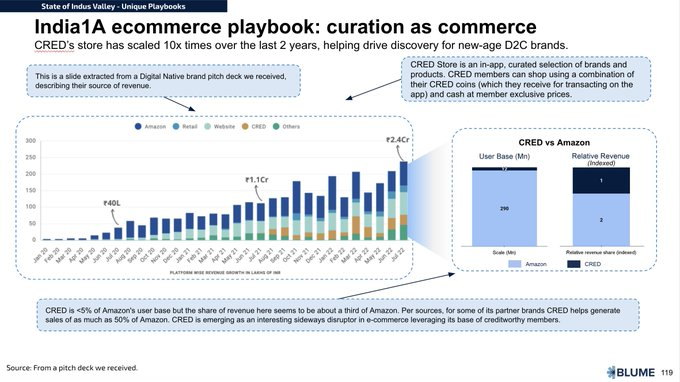
While e‑commerce firms have added merchant media as a revenue stream, on the other side of the spectrum, FinTech firms are adding e‑commerce as a revenue stream by curating a discovery layer for India1.
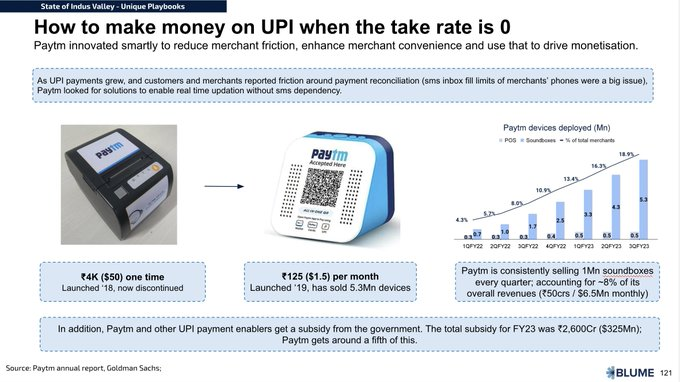
PayTM innovated on reducing merchant friction and making it easier for them to reconcile payments, creating a new revenue stream.
Author


Sajith Pai
I am greedy to be part of ambitious founder journeys, and help inflect them to greatness. The founders who select me to be part of their journeys, pick me to be their PMF coach, social media cheerleader, sparring partner, 11 pm friend,…- Current Section
- Partner
- Sector
- EdTech, HRTech, ConsumerTech, B2B Commerce & Marketplaces