Insights from a decade of Indian Mainboard IPOs | Part 2: Financials, Valuation and Employee Metrics


Welcome back to our Insights from a decade of Indian Mainboard IPOs series! In this Part 2, we shift our lens from pre-IPO demographics to the financial performance and capital efficiency of listed companies over the past decade. Join us on this journey as we aim to provide insights to help founders benchmark their companies against the financial metrics of those who have gone Public!
In this study, we analyze 291 mainboard IPOs listed between January 2015 to December 2023 and compare key metrics from when companies were listed on the stock exchange to as they stood in FY 2024.
Resource
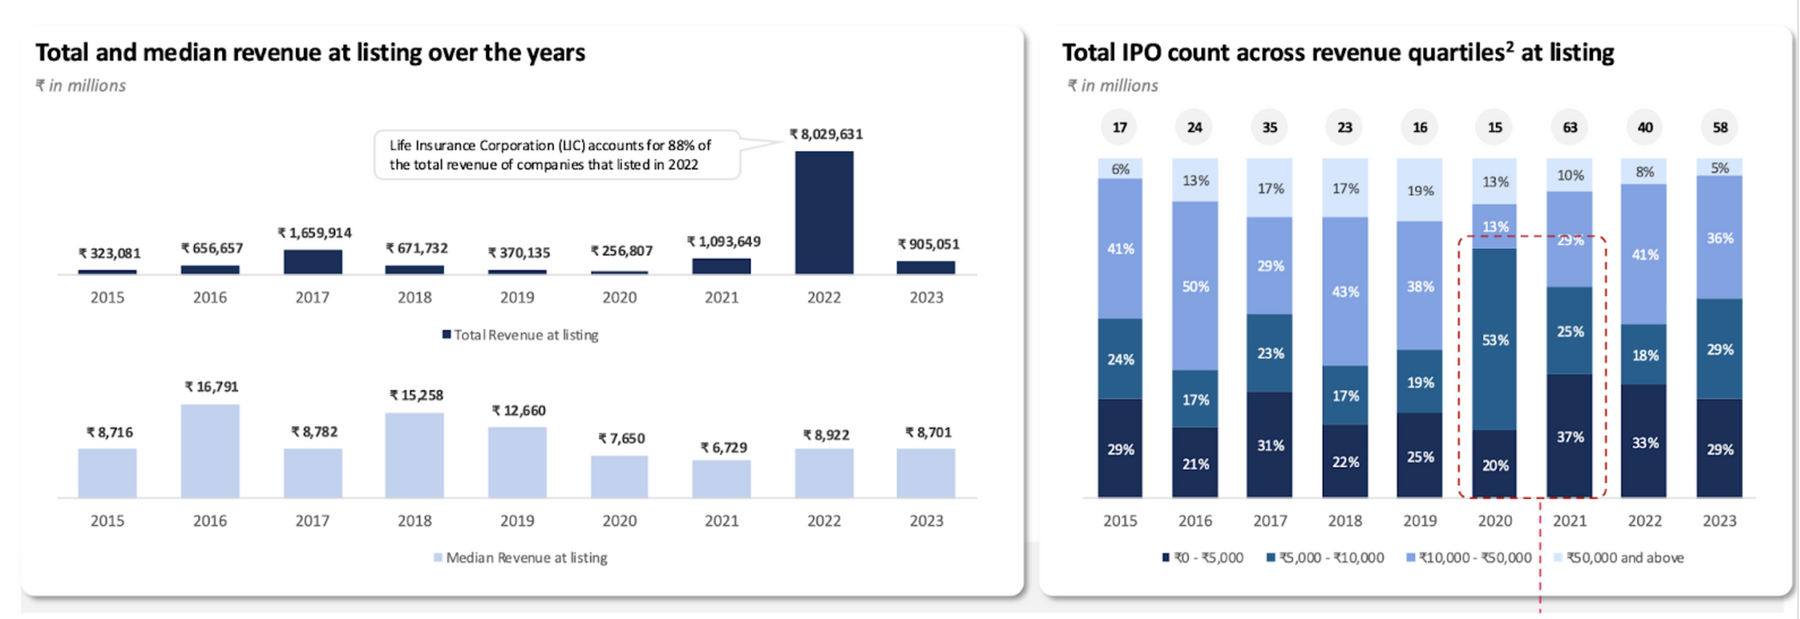
#1 More companies with <1000Cr revenue are going IPO — 60%+ companies in FY24.
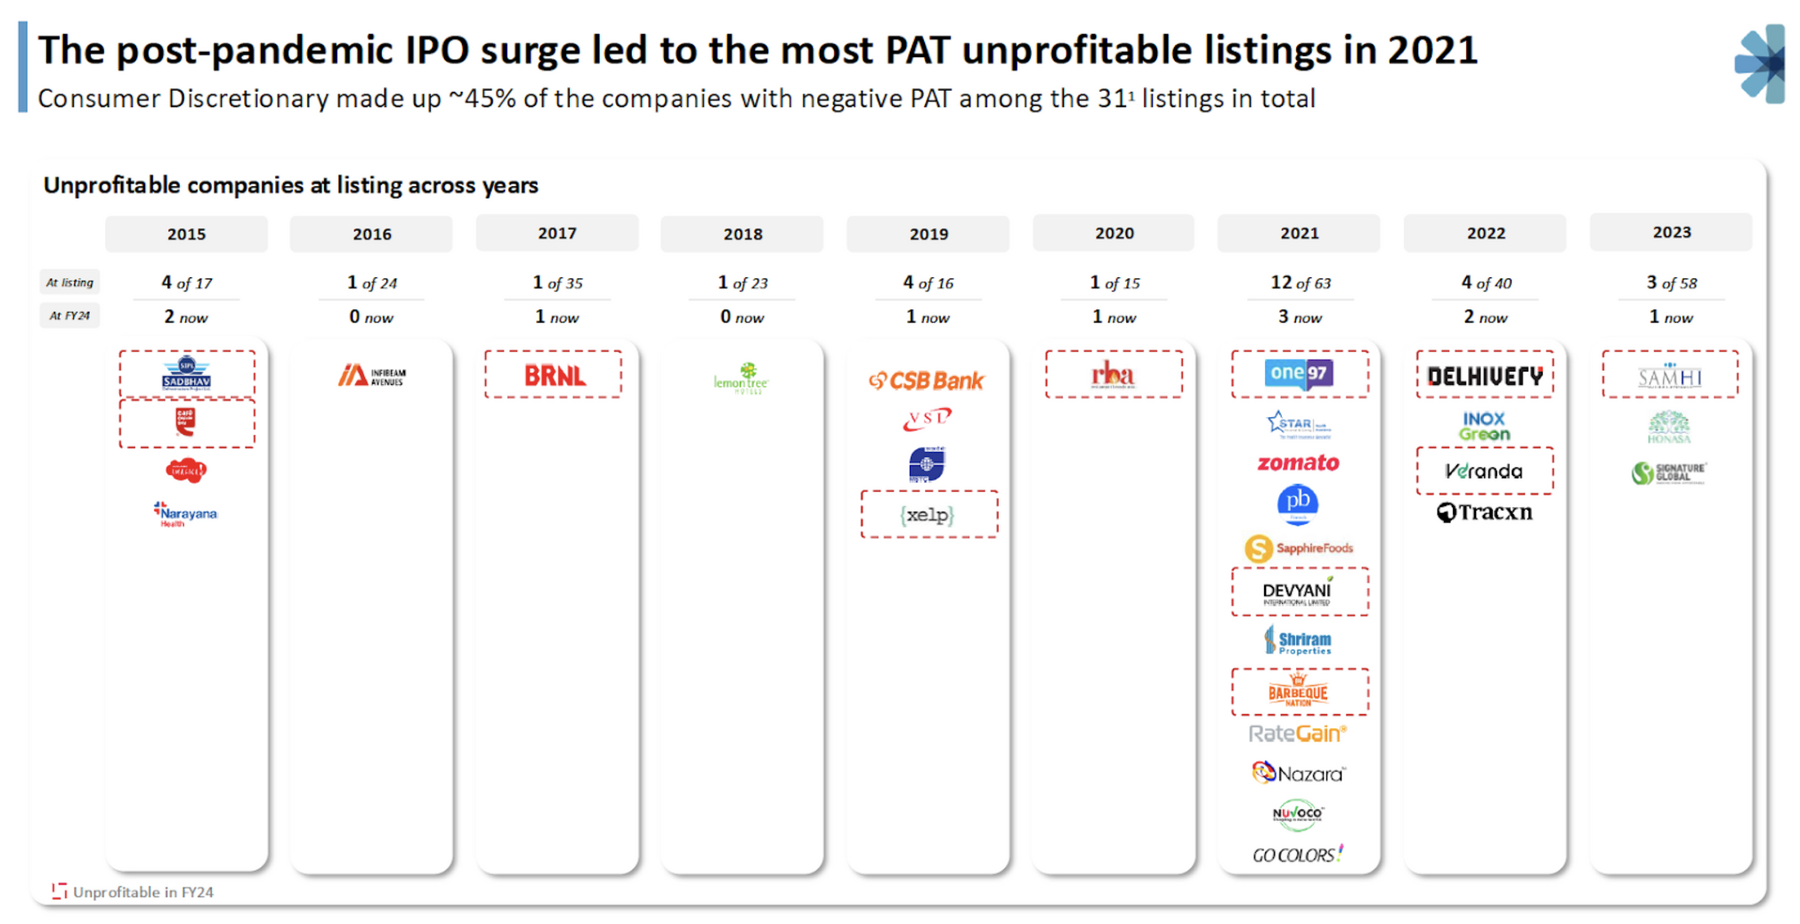
#2 Majority of companies listed with positive EBITDA margins — only 9 companies listed with negative EBITDA.
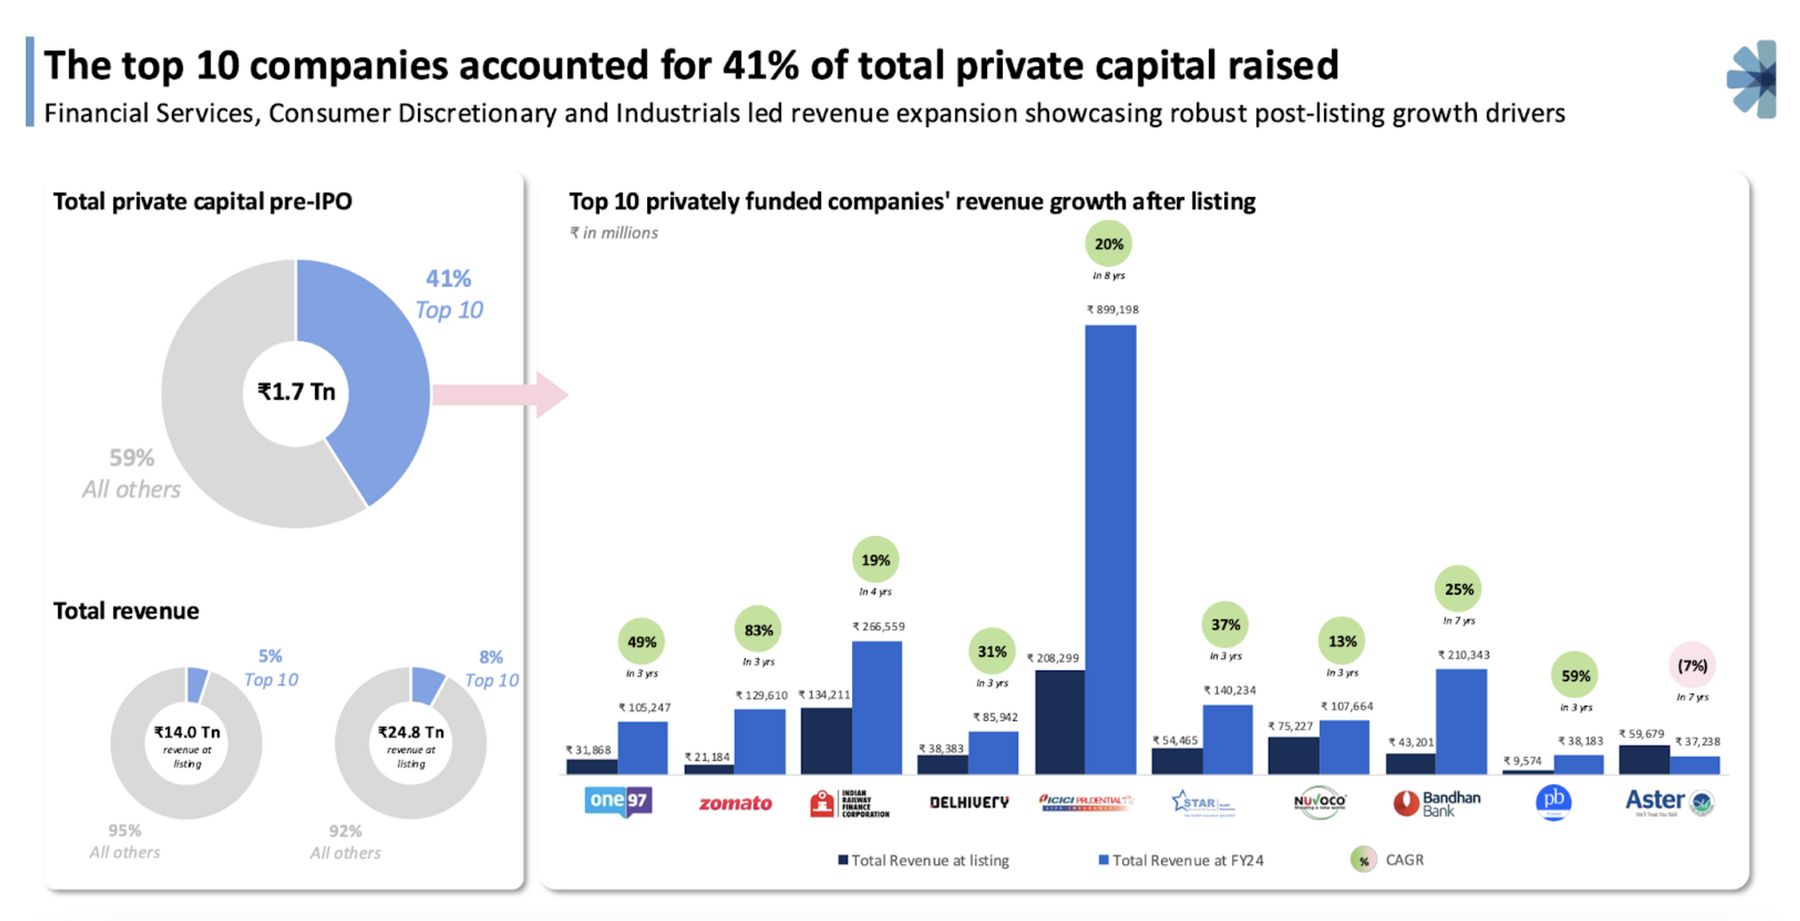
#3 10 companies attributed 40% of the total private capital ever raised by this cohort of 291 companies.
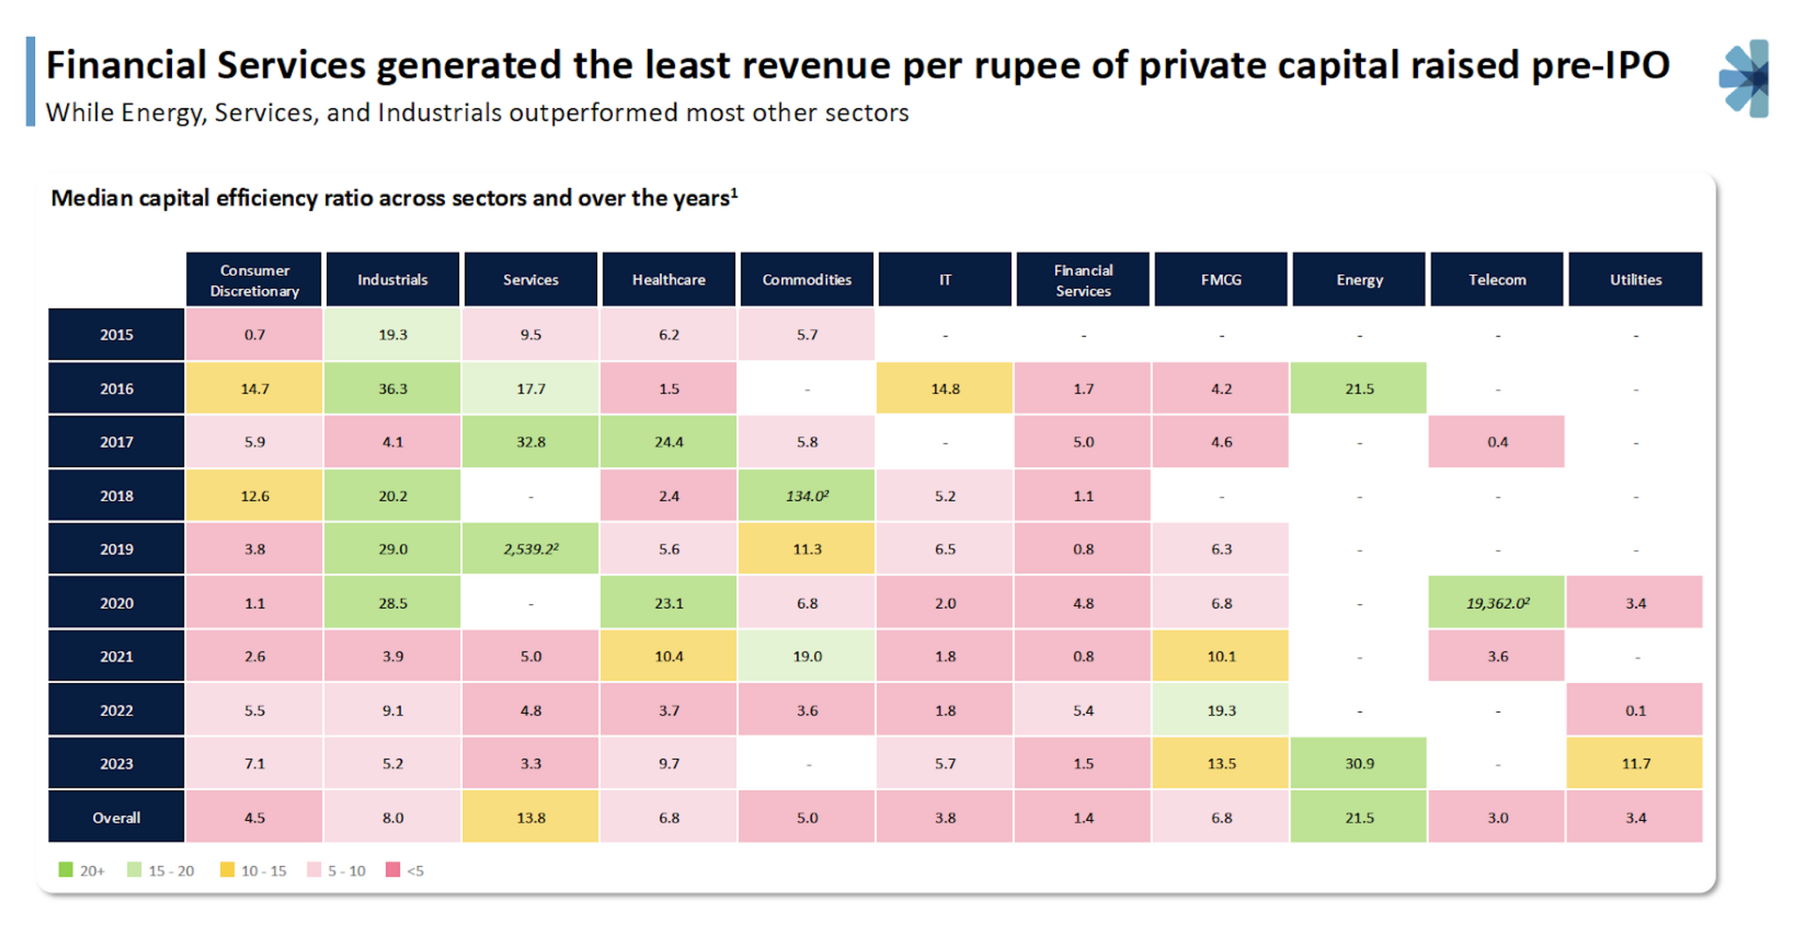
#4 Financial Services, IT & Telecom showed the lowest comparative capital efficiency across years.
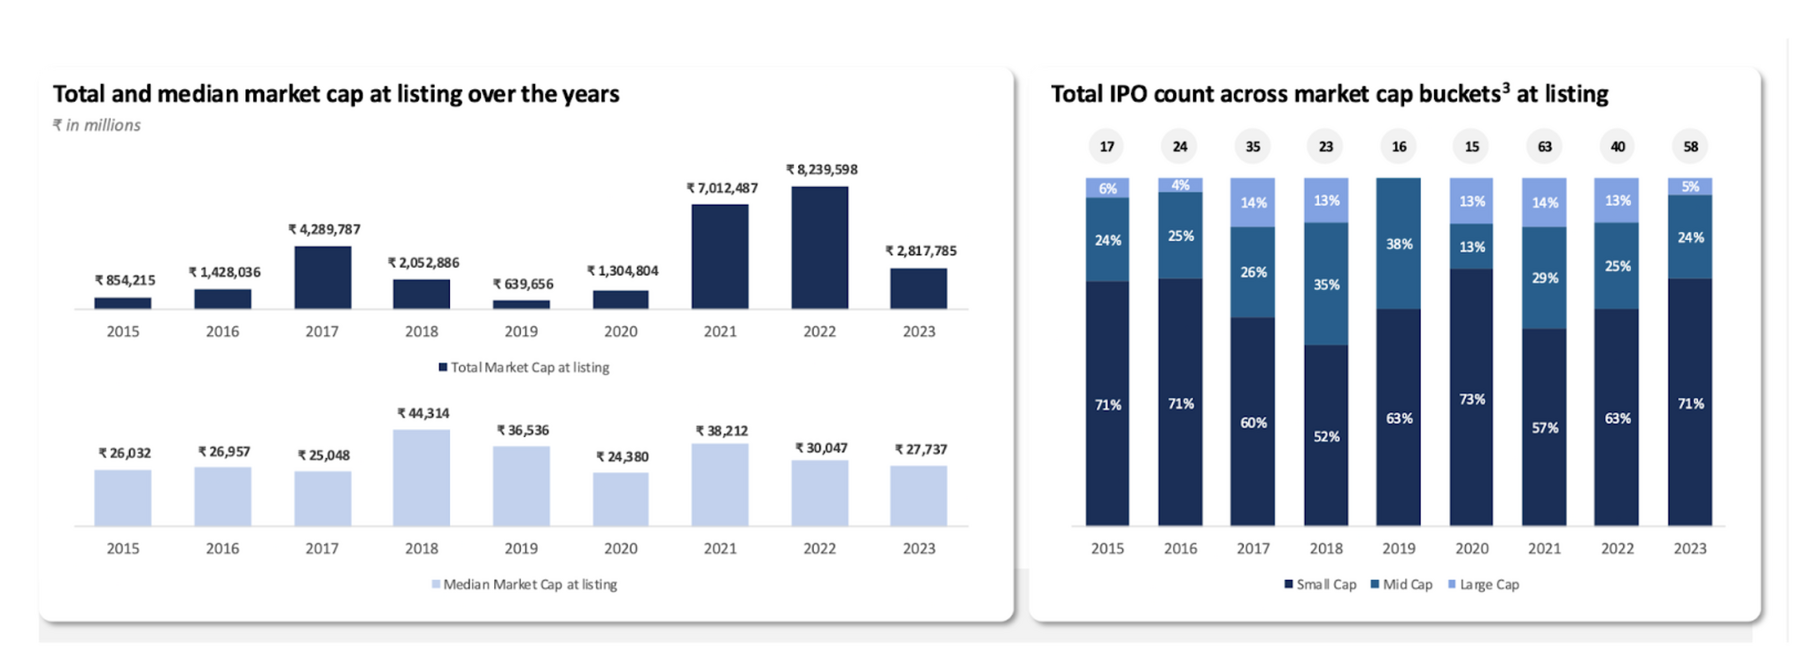
#5 Small-cap IPOs have consistently dominated listings over the past decade — 71% of IPOs in 2023.
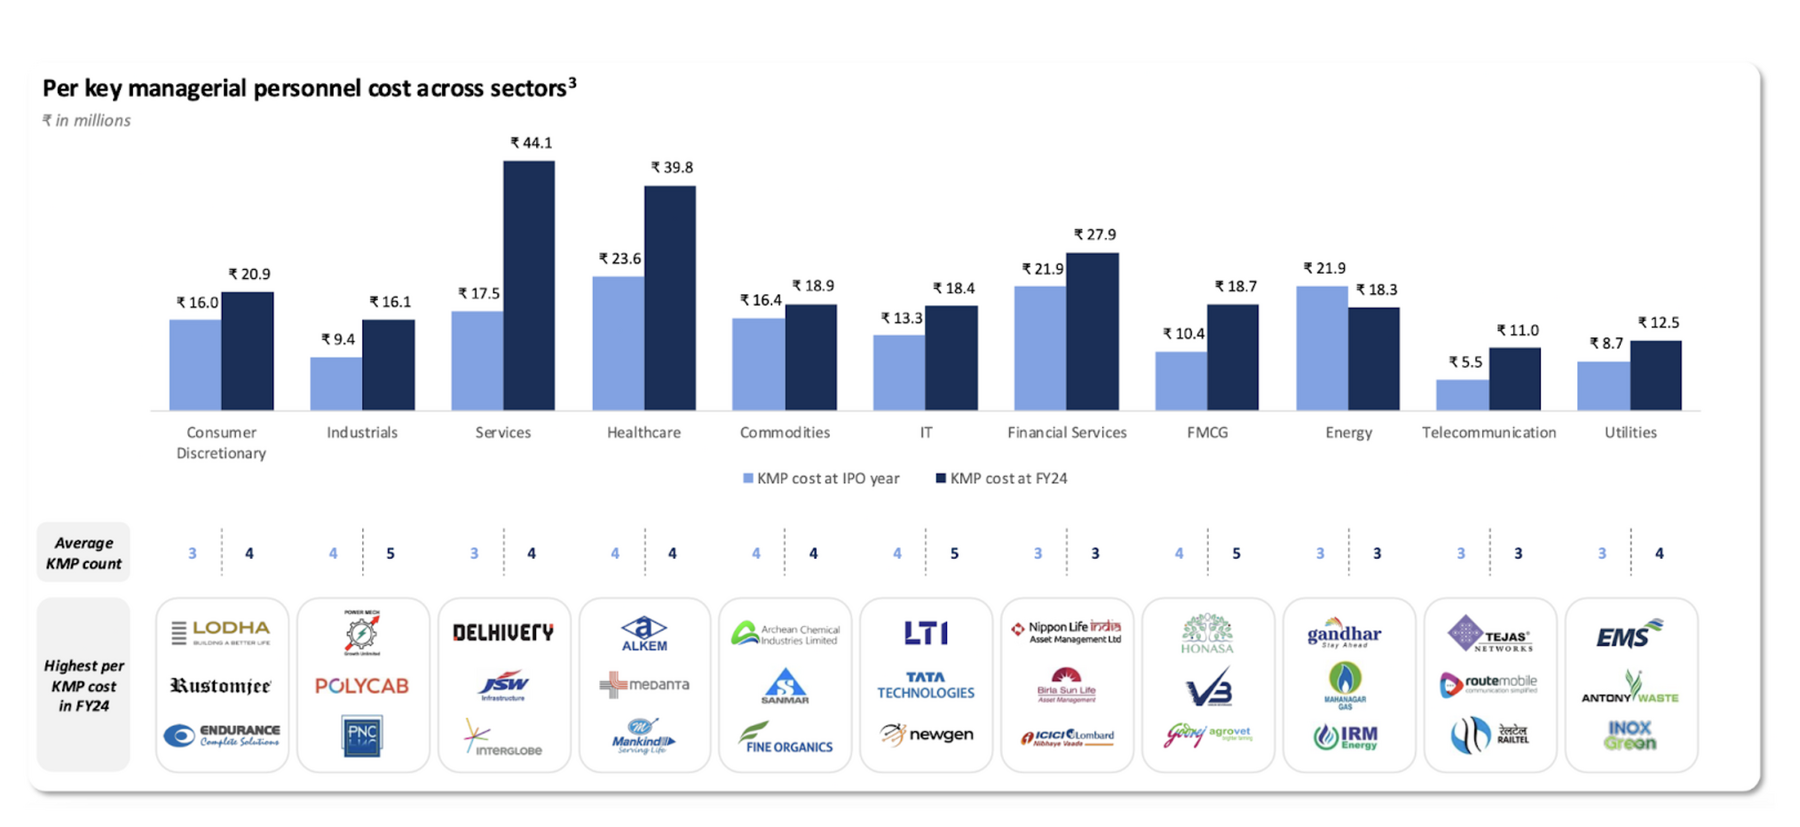
#6 Average KMP Costs have been on the rise.
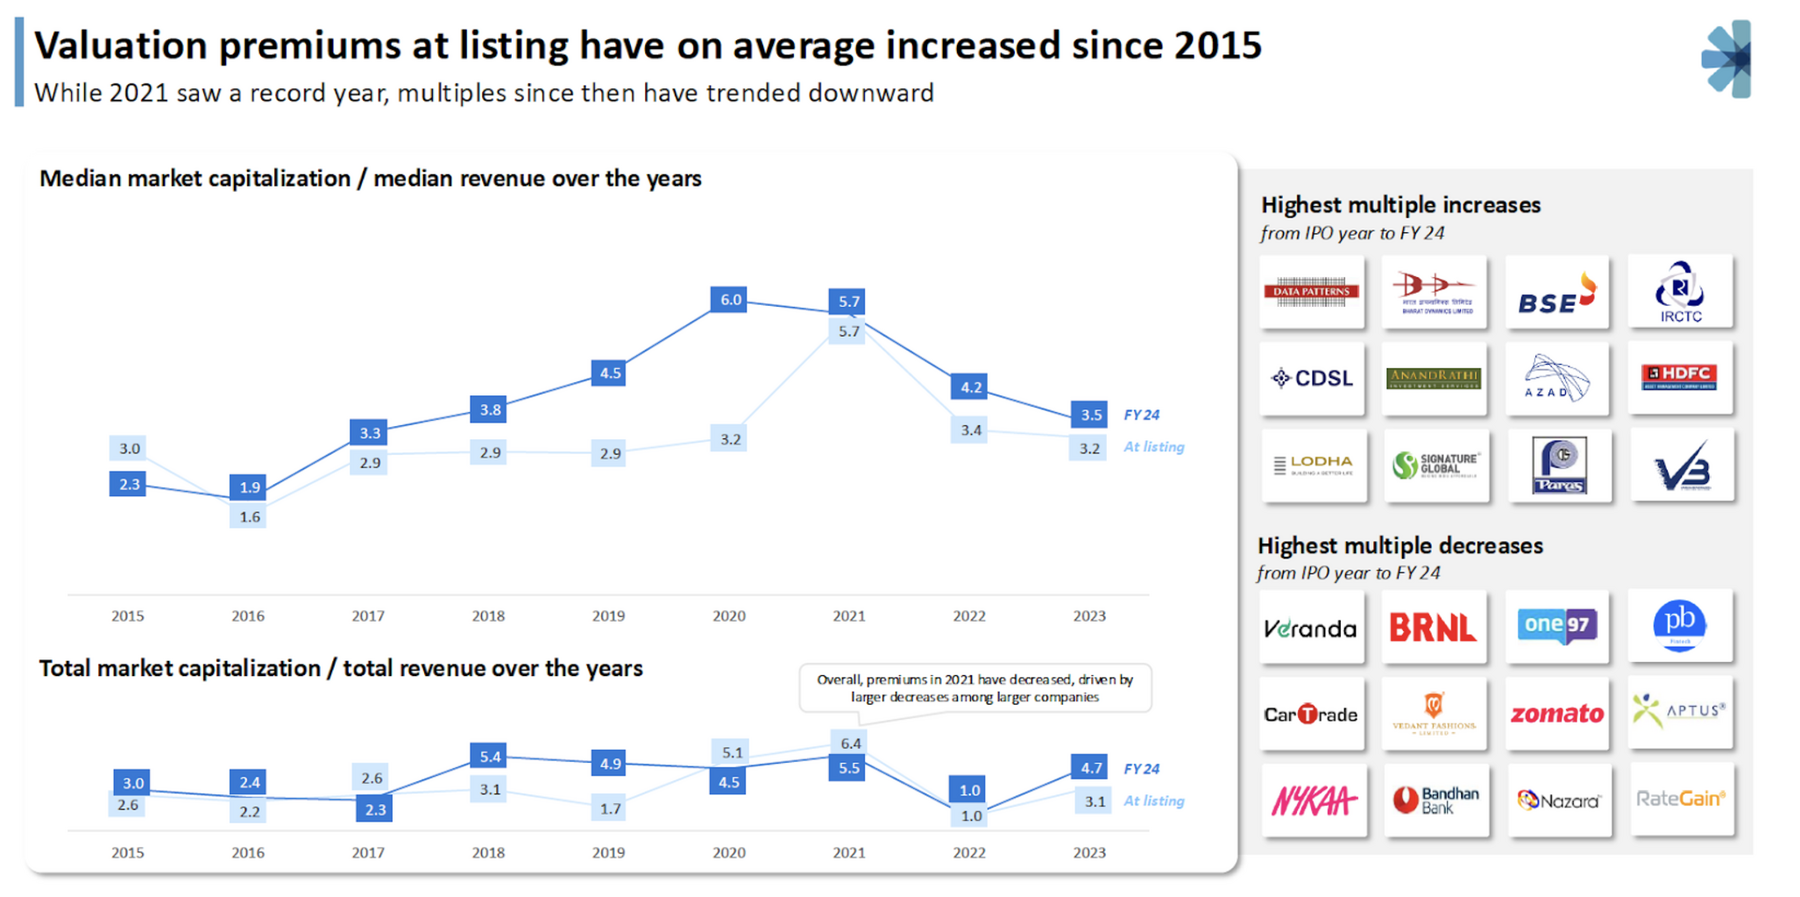
#7 Most of the IPO revenue multiples have been rerated upwards.
We invite you to read the complete report here! We welcome any thoughts/questions.
Authors


Aria Pradhan
Aria focuses on growth-stage investments at Blume. She comes with Investment Banking experience from DC Advisory’s technology and software M&A group.Aria graduated from Brandeis University, where she received a…- Current Section
- Senior Analyst

Vikram Gawande
Vikram takes care of growth investments at Blume. He has 16+ years of experience across Technology, Consumer Internet and Venture Investments.He has spent more than a decade in the startup world, both as an entrepreneur and an…- Current Section
- Director, Growth Investment